Introduction
The human immunodeficiency virus (HIV) infects the immune system of humans and results in acquired immunodeficiency syndrome (AIDS) [1]. It occurs due to direct viral destruction of infected cells, increased rates of apoptosis in infected cells, and CD8 cytotoxic lymphocytes killing infected CD4+ T cells [2]. AIDS develops due to the steady depletion of immune cells, resulting in life-threatening opportunistic infections. There is a strong link between HIV (AIDS) and nutrition [3]. Malnutrition can lead to the suppression of the immune system [4]. In contrast, HIV infection affects nutrition by increasing resting energy expenditure, decreasing food intake, nutrient malabsorption and loss, and altering metabolism, all of which contribute to weight loss and wasting in AIDS patients [5].
Malnutrition weakens the immune system [6], exacerbates the effects of HIV, and hastens the onset of AIDS [3, 7]. Extreme malnutrition contributes to nutritionally acquired immune deficiency syndrome (NAIDS), a form of immunodeficiency [3]. Subjective global assessment is a clinical tool for determining nutritional status based on the patient's medical history and physical examination [8].
The total protein is a biochemical test that determines how much protein is in the blood. It can also diagnose the liver malfunction and assess dietary issues such as protein-energy deficiencies [9]. Albumin and globulin make up serum protein [10]. In addition, the globulin is composed of α1, α2, β, and γ globulin [11]. The primary function of total protein and albumin is to maintain regular water transport between tissue and blood. Albumin regulates the oncotic pressure of serum and transports various chemicals, including macromolecules [12, 13]. Serum albumin, the most common blood serum protein, is produced in the liver and accounts for a considerable part of all serum protein [13].
Estimating hemoglobin concentration indicates the oxygen and carbon dioxide carrying capacity between lungs and other tissues [14]. It is also important as an initial step in diagnosing anemia and erythrocytosis. Blood hemoglobin concentration may be decreased due to hemolysis or impaired blood formation in the bone marrow [15]. Conversely, blood hemoglobin concentration may be increased in poor lung function or hypoxia [16].
Iron is a trace element required for cell function, and its lack or excess is linked to various diseases [17]. Iron overload can also be caused by a high quantity of iron in the plasma as a result of fast red cell death or excessive iron uptake. Hemosiderosis is an overabundance of iron in the tissues caused by iron overload [18]. On the other hand, a low level of iron in the plasma due to malnutrition or malabsorption can lead to anemia, such as iron-deficiency anemia [19].
Zinc is required for optimal thymus development and maintenance [20]. Zinc deficiency reduces antibody synthesis, interfering with the function of T-Lymphocyte helpers [21]. Zinc is required for protein synthesis and hence contributes to the normal function of immune cells. Zinc is required for granulocytes to perform their usual bactericidal and phagocytic functions. Acrodermatitis enteropathica is a condition in which the body fails to absorb zinc due to an inborn metabolic mistake, resulting in insufficiency [22]. Natural killer cell function is suppressed by zinc deficiency [23].
Copper is a necessary trace element that, in excess, can be harmful. Only a tiny amount of copper in the blood is free [20], and most of the copper in the blood is linked to the enzyme ceruloplasmin. Copper is needed for aerobic respiration, neurotransmitter biosynthesis, peptide amidation, pigment production, and connective tissue strength [24]. It is crucial for the development of the central nervous system. Copper deficiency can cause hematological and neurological disorders, while too much copper can be dangerous. Copper functions as both an antioxidant and a pro-oxidant [25], and it is an antioxidant that acts as a cofactor for several enzymes, including superoxide dismutase, preventing some of the harm that free radicals can cause in the body. Copper, as a pro-oxidant, may contribute to free radical formation, which can result in mitochondrial damage, DNA breakage, lipid damage, and neuronal injury [25].
Selenium is a vital mineral that plays an important function in human nutrition. The structural components of selenoprotein are selenocysteine and selenomethionine. Besides, antioxidant enzymes contain selenium, including glutathione peroxidase and thioredoxin reductase [26]. The iodothyronine deiodinases and iodothyronine deiodinase [27] also contain this mineral. The conversion of inactive thyroid hormone to active thyroid hormone is carried out by deiodinase enzymes [28]. Selenium is a natural antiviral, inhibiting reverse transcriptase activity, which HIV uses to generate more copies of itself and nuclear factor-kappa binding, the key stimulant for HIV replication in CD4 cells' nuclei [29].
Materials and Methods
Study design
This is a cross-sectional survey study. The study was enrolled by the convenient sampling method of 50 already diagnosed HIV subjects (25 drug-naive and 25 subjects on highly active antiretroviral therapy (HAART)) and 20 apparently healthy control subjects aged 21 to 65 years. The clinical status of the subjects was obtained from their hospitals' records. This study was carried out in Nnamdi Azikiwe University Teaching Hospital, Nnewi, Anambra State, Nigeria. Ethical approval for this study was obtained from Nnamdi Azikiwe University Teaching Hospital Ethics Committee and Ethics Committee, Faculty of Health Sciences and Technology, College of Health Science, Nnamdi Azikiwe University, Nnewi Campus. The subjects were informed about the study's purpose, and only those giving their consent were recruited for the study. Already diagnosed HIV-positive subjects from 21 to 65 were recruited for the study. Subjects below 21 and above 65 were excluded from this study. Data was collected through a questionnaire, subjective global assessment, anthropometric measurements, and laboratory analysis of blood samples.
Anthropometric measurements
The anthropometric measurements used for nutritional assessment were weight, height, and mid-upper arm circumference. Weight and height were measured with a standard beam balance scale and a stadiometer, respectively, while participants wore light clothing and no shoes. Mid-upper arm circumference was obtained with a World Health Organization standardized tape. Then, values were approximated to the nearest 0.1 kg and 0.1 m. body mass index (BMI) was calculated as weight in kilograms divided by height in meters squared.
Biochemical analysis
Six milliliters (6 ml) of venous blood sample were collected from each subject using a 10 ml sterile disposable syringe. About 4 ml of the blood samples were dispensed into 5 ml plain containers, and 2 ml of the samples were dispensed into ethylenediaminetetraacetic acid (EDTA) sample containers labeled with the subject's name, age, and sex. The blood was spun for 5 minutes at 3000 rpm. The serum was separated from the red cells using a dry clean Pasteur Pipette. It was put into a dry clean, labeled plain specimen container. It was then stored at -20°C in a refrigerator. The biochemical analysis carried out with serum was total protein, serum albumin, iron, copper, zinc, and selenium, while whole blood was used for hemoglobin estimation and CD4 count.
Total protein was estimated by the Biuret method as described by Gornall et al. [30], with a kit assay system (Cromatest, Spain). Albumin was estimated by the Bromocresol green method as described by Doumas et al. [31], with a kit assay system (Cromatest, Spain). Serum globulin was estimated indirectly by subtracting the albumin concentration from the total protein concentration. Serum globulin (g/dl) = Total protein (g/dl) - serum albumin (g/dl).
Hemoglobin was measured by Colorimetric method. Atomic Absorption Spectroscopy was used to measure Iron, Copper, Zinc, and Selenium. Agilent 240FS AA system from Agilent Technologies, USA, was used. The analytical wavelengths were set at 248.3, 324.8, 213.9, and 196.0 nm for iron, copper, zinc, and selenium. The results were displayed digitally in part per million (ppm). CD4 count was done with Sysmex Partec CyFlow Counter, which uses a fluorometric technique to detect CD4 cells.
Subjective global assessment
The study used a subjective global assessment form to assess the patients' nutritional status [8]. According to their SGA form, their nutritional status was classified into well nourished, moderately malnourished, and severely malnourished according to their score.
Statistical analysis
The data from this study were subjected to statistical analysis using a computer program known as SPSS package, version 23, and presented as mean ± standard deviation. The significance of variation within and among groups was compared using ANOVA at a 95% confidence level, and post-hoc (Tukey) analysis was used to compare multiple variables. Fishers' exact test was used to analyze subjective global assessment data. All the results are presented as mean ± SD. The p-value ≤ 0.05 was considered statistically significant.
Results
Table 1 shows the anthropometric parameters of drug-naive HIV subjects, HIV subjects on HAART, and control subjects. The weight in drug-naive subjects (57.36 ± 9.17 kg) were significantly lower (p = 0.000) when compared with the HIV subjects on HAART (69.72 ± 11.47 kg) and control subjects (76.35 ± 9.95 kg) (p= 0.026). Also, the weight of the HIV subjects on HAART (69.72 ± 11.47 kg) was significantly lower (p < 0.001) when compared with the control subjects (76.35 ± 9.95 kg). The body mass index of drug-naive subjects (19.20 ± 2.04 kg/m2) were significantly lower compared with HIV subjects on HAART (22.74 ± 2.59 kg/m2) (p < 0.001) and control subjects (24.65 ± 1.32 kg/m2) (p = 0.009). Body mass index of HIV subjects on HAART (22.74 ± 2.59 kg/m2) were significantly lower (p < 0.001) compared with the control subjects (24.65 ± 1.32 kg/m2). The mid-upper arm circumference of drug-naive subjects (1.88 ± 0.14 m) was significantly lower compared with HIV subjects on HAART (2.11 ± 0.35 m) and control subjects (2.66 ± 0.58 m) (p < 0.001; 0.006), respectively. Mid-upper arm circumference of HIV subjects on HAART (2.11 ± 0.35 m) was significantly lower (p < 0.001) when compared with control subjects (2.66 ± 0.58 m) in this study.
Table 2 shows the biochemical parameters of drug-naive HIV subjects, HIV subjects on HAART, and control subjects. Table 3 compares the CD4 count of drug-naive subjects and HIV subjects on HAART in the study. This table also shows that the CD4 count in drug-naive HIV subjects was significantly lower (p = 0.000) than in HIV subjects on HAART.
Table 1. Anthropometric parameters of drug-naive HIV subjects, HIV subjects on HAART, and control subjects in the study
| Groups |
Weight (kg) |
BMI (kg/m2) |
MUAC (m) |
| Drug-naïve (N = 25) |
57.36 ± 9.17 |
19.20 ± 2.04 |
1.88 ± 0.14 |
| HAART (N = 25) |
69.72 ± 11.47 |
22.74 ± 2.59 |
2.11 ± 0.35 |
| Control (N = 20) |
76.35 ± 9.95 |
24.65 ± 1.32 |
2.66 ± 0.58 |
| F-value |
22.134 |
40.088 |
15.534 |
| P-value |
0.000 |
0.000 |
0.000 |
| A vs. B |
0.000 |
0.000 |
0.000 |
| A vs. C |
0.026 |
0.009 |
0.006 |
| B vs C |
0.000 |
0.000 |
0.000 |
BMI = Body mass index; MUAC = Mid-upper arm circumference
Data are presented as Mean ±SD and p ≤ 0.05 is significant
Table 2. Biochemical parameters of drug-naive HIV subjects, HIV subjects on HAART, and control subjects in the study
| Groups |
Total protein
(g/dl) |
Albumin
(g/dl) |
Globulin (g/dl) |
Albumin Globulin Ratio |
Hemoglobin (g/dl) |
Iron
(ppm) |
Zinc
(ppm) |
Copper (ppm) |
Selenium
(ppm) |
Drug naive
(N = 25) |
9.63 ± 1.71 |
2.30 ± 0.27 |
7.33 ± 1.69 |
0.33 ± 0.10 |
11.92 ± 1.10 |
0.54 ± 0.05 |
0.58 ± 0.09 |
1.35 ± 0.17 |
0.57 ± 0.06 |
HAART
(N = 25) |
8.48 ± 1.93 |
2.68 ± 0.27 |
5.80 ± 2.01 |
0.52 ± 0.20 |
12.82 ± 1.12 |
0.63 ± 0.08 |
0.75 ± 0.11 |
0.81 ± 0.12 |
0.72 ± 0.09 |
Control
(N = 20) |
7.05 ± 0.84 |
3.44 ± 0.36 |
3.61 ± 0.95 |
1.02 ± 0.30 |
13.58 ± 0.21 |
1.18 ± 0.14 |
1.18 ± 0.15 |
0.77 ± 0.09 |
1.06 ± 0.14 |
| F-value |
14.436 |
84.639 |
28.417 |
63.545 |
14.987 |
293.171 |
144.971 |
143.698 |
138.011 |
| p-value |
0.000 |
0.000 |
0.000 |
0.000 |
0.000 |
0.000 |
0.000 |
0.000 |
0.000 |
| A vs B |
0.035 |
0.000 |
0.004 |
0.005 |
0.018 |
0.003 |
0.000 |
0.000 |
0.000 |
| A vs C |
0.011 |
0.000 |
0.000 |
0.000 |
0.017 |
0.000 |
0.000 |
0.000 |
0.000 |
| B vs C |
0.000 |
0.000 |
0.000 |
0.000 |
0.000 |
0.000 |
0.000 |
0.619 |
0.000 |
Data are presented as Mean ±SD and p ≤ 0.05 is significant
Table 3. CD4 count of drug-naive HIV and HIV subjects on highly active antiretroviral therapy
| Parameters |
Drug-naive
(N = 25) |
HAART
(N = 25) |
t-value |
p-value |
| CD4 (cells/µL) |
309.48 ± 140.35 |
486.20 ± 119.82 |
4.788 |
0.000 |
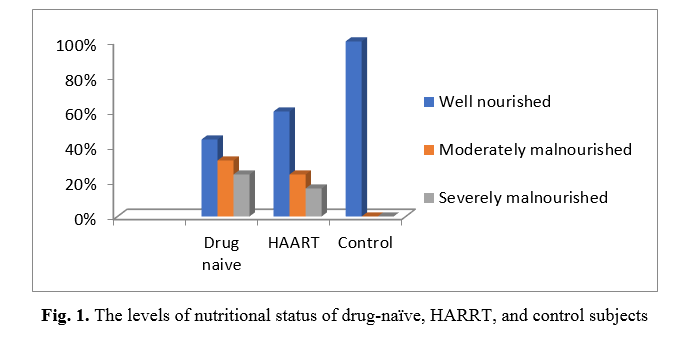
Figure 1 shows that 11 (44%), 8 (32%), and 6 (24%) of drug-naive HIV subjects were well nourished, moderately malnourished, and severely malnourished, respectively. Also, 15 (60%), 6 (24%), and 4 (16%) of HIV subjects on HAART were well nourished, moderately malnourished, and severely malnourished, respectively. 20 (100%), 0 (0%), and 0 (0%) of control subjects were well nourished, moderately malnourished, and severely malnourished, respectively. Furthermore, Fisher's Exact test showed significantly (p = 0.001) malnourished subjects in drug-naive subjects compared to HIV subjects on HAART and control subjects.
Discussion
Malnutrition and the impact of HIV/AIDS are linked in a cyclic pattern [3, 32]. Extrinsic conditions such as HIV/AIDS and malnutrition can cause immunodeficiency, exposing the body to opportunistic infection [33].
The result of HIV-infected subjects (drug-naive and HARRT) compared with the control showed a significant difference in weight, BMI, MUAC, total protein, albumin, albumin – globulin ratio, hemoglobin, iron, zinc, copper, and selenium. These results obtained in this study agree with those reported by Wadgera et al. [34]. The weight, BMI, MUAC, albumin, albumin-globulin ratio, hemoglobin, iron, zinc, and selenium were generally lower in drug-naive HIV subjects and HIV subjects on HAART compared with the control subjects. Total protein, globulin, and copper levels were higher in the drug-naive HIV subjects and HIV subjects on HAART compared with the control subjects. The low levels of weight, BMI, MUAC, albumin, albumin-globulin ratio, hemoglobin, and iron may be due to muscle wasting, anorexia, malnutrition, malabsorption, and anemia present in HIV infection, which is in line with the report by Patil and Raghuwanshi [35], Daniel et al. [36], and Shivaji and Ramesh [37]. The low MUAC is an indication of poor nutritional status. Sicotte et al. reported low BMI and albumin, and hypoalbuminemia was associated with low hemoglobin levels and CD4 count at baseline. They stated that BMI, albumin, and hemoglobin levels increased within the first six months of initiation of treatment [38]. The decline in the albumin-globulin ratio in drug-naive subjects compared with HIV subjects on HAART and control subjects may be due to extra immunoglobulin production by hyperactive B cells [39]. The increased level of the total protein and globulin in the drug-naive and HIV subjects on HAART occurs due to the inflammatory process with probably increased antibody production initiated by the immune system. This agrees with the report by Akinpelu et al. [40]. The observed difference in the trace elements such as copper, zinc, and selenium may be due to chronic infection and inflammatory processes in HIV patients. This is in line with the findings by Amare et al. [41]; Abd Elatif et al. [42]. The increased copper could be due to an increase in ceruloplasmin, an acute-phase protein [43]. The observed low level of zinc may be due to nutrient malabsorption, diarrhea, and the formation of zinc fingers [44]. Zinc fingers form parts of some transcription factors, which are proteins that recognize DNA base sequences during the replication and transcription of DNA. Zinc fingers interact with HIV and promote its transcriptional activity [45]. Als HIV transactivating protein (Tat) has a high binding affinity for zinc [46]. The observed low level of selenium occurred due to HIV incorporating host selenium into the viral seleno-proteins leading to the depletion of the host selenium [47].
The CD4 count in drug-naive subjects was significantly lower when compared with HIV subjects on HAART. The observed low level of CD4 count in naive drug HIV subjects might result from the viral depletion of the CD4 cells. Also, the subjective global assessment showed that malnutrition was higher in the drug-naive group when compared with HIV subjects on HAART. This may be because of the possible effect of the virus and immunodeficiency. These findings agree with Daniel et al. [36]; Gebrezgabher et al. [48].
Conclusion
Low levels of weight, BMI, MUAC, albumin, albumin-globulin ratio, hemoglobin, iron, zinc, and selenium were observed in drug-naive HIV subjects and HIV subjects on HAART compared with the control subjects. Total protein, globulin, and copper levels were higher in the drug-naive HIV subjects and HIV subjects on HAART compared with the control subjects.
The CD4 count in drug-naive subjects was lower than the CD4 count of HIV subjects on HAART. Malnutrition was higher in the drug-naive subjects. Nutritional assessment, serum protein, AGR, hemoglobin, and trace elements such as iron, zinc, copper, and selenium may serve as inexpensive tests to monitor HIV disease progression and malnutrition. Also, anthropometric measurements such as weight, BMI, and mid-upper arm circumference can be used to monitor malnutrition associated with the burden of HIV infection in resource-limited clinical settings.
Conflict of Interest
The authors declare that they have no conflict of interest.
Acknowledgments
The authors are immensely grateful to HRH Igwe Charles O. Ugwu and Lolo Chief Marcelina N. Ugwu, Engr. Princess Ijeoma N. Ozor, Princess Loveth N. Ugwu, Prince Ifeanyi E. Ugwu, Nwosu Adaeze Amalachukwu, and all contributed to this research.
References
- Malani PN. Human immunodeficiency virus. J Amer Medi Assoc. 2016; 316(2): 238.
- Okoye AA, Picker LJ. CD4(+) T-cell depletion in HIV infection: mechanisms of immunological failure. Immunol Rev 2013; 254(1): 54-64.
- Duggal S, Chugh TD, Duggal AK. HIV and malnutrition: effects on immune system. Clin Dev Immunol. 2012; 2012(1): 1-8.
- Cohen S, Danzaki K, MacIver NJ. Nutritional effects on T-cell immunometabolism. Eur J Immunol. 2017; 47(2): 225-35.
- Pee SD, Semba RD. Role of nutrition in HIV infection: review of evidence for more effective programming in resource-limited settings, the United Nations University. Nutr Bull 2010; 31: 313-44.
- Rajeswari G, Gopal PS, Suresh E, Prasad GBV. Biochemical changes in HIV related malnutrition in children. J Dent Med Sci. 2015; 14(5): 2261-276.
- Kalil FS, Kabeta T, Jarso H, Hasen M, Ahmed J, Kabeta S. Determinants of undernutrition among adult people on antiretroviral therapy in Goba Hospital, Southeast Ethiopia: A case–control study. Nutr Diet Suppl. 2020; 12: 223-36.
- Detsky AS, McLaughlin JR, Baker JP, Johnston N, Whittaker S, Mendelson RA, et al. What is subjective global assessment of nutritional status? Nutricion hospitalaria. 1987; 11(4): 8-13.
- Henok JN, Okeleye BI, Omodanisi EI, Ntwampe SKO, Aboua YG. Analysis of reference ranges of total serum protein in Namibia. Clinical Implications Proteomes 2020; 8(2): 1-10.
- Shingdang J, Bot Y, Ojo O, Edeh O, Essien C, Bwende E, et al. Serum albumin/globulin ratio in tuberculosis and HIV patients any relationship? Mycobact Dis. 2016; 6(1): 1-6.
- Wang Y, Li S, Hu X, Wang Y, Wu Y, Li P, et al. The prognostic value of serum albumin–globulin ratio in early-stage non-small cell lung cancer: a retrospective study. Cancer Manag Res. 2019; 11(4): 3545-554.
- Naveen R, Akshata K, Pimple S, Chaudhari P. A review on albumin as drug carrier in treating different diseases and disorders. Der Pharmacia Sinica 2016; 7(1): 11-15.
- Chang DC, Xu X, Ferrante AW, Krakoff J. Reduced plasma albumin predicts type 2 diabetes and is associated with greater adipose tissue macrophage content and activation. Diabetol Metab Syndr. 2019; 11(1): 1-8.
- Collins JA, Rudenski A, Gibson J, Howard L, O'Driscoll R. Relating oxygen partial pressure, saturation and content: the haemoglobin-oxygen dissociation curve. Breathe (Sheff) 2015; 11(1): 194-201.
- Chaparro CM, Suchdev PS. Anemia epidemiology, pathophysiology, and etiology in low- and middle-income countries. Ann N Y Acad Sci. 2019; 1450: 15-31.
- Akunov A, Sydykov A, Toktash T, Doolotova A, Sarybaev A. Hemoglobin changes after long-term intermittent work at high altitude. Front Physiol. 2018; 9(1): 1-7.
- Parmar BJ, Doctor J, Ashmita R, Danu BJ. Iron deficiency: Beyond anemia. Acad J Pediatr Neonatol. 2016; 2(1): 1-4.
- Gujja P, Rosing DR, Tripodi DJ, Shizukuda Y. Iron overload cardiomyopathy: better understanding of an increasing disorder. J Am Coll Cardiol. 2010; 56(13): 1001-1012.
- Cairo RC, Silva LR, Bustani NC, Marques CD. Iron deficiency anemia in adolescents; a literature review. Nutr Hosp. 2014; 29(6): 1240-249.
- Prashanth L, Kattapagari KK, Chitturi RT, Baddam VR, Prasad LK. A review on role of essential trace elements in health and disease. J NTR University of Health Science 2015; 4(2): 75-85.
- Calder PC. Nutrition, immunity and COVID-19. BMJ Nutr Prev Hlth. 2020; 3(1): 74-92.
- Ciampo IRLD, Sawamura R, Ciampo LAD, Fernandes MIM. Acrodermatitis Enteropathica: clinical manifestations and pediatric diagnosis. Rev Paul Pediatr. 2018; 36(2): 238-41.
- Skrajnowska D, Bobrowska-Korczak B. Role of zinc in immune system and anti-cancer defense mechanisms. Nutrients 2019; 11(10): 1-28.
- Dempsey JL, Little M, Cui JY. Gut microbiome: an intermediary to neurotoxicity. Neurotoxicology 2019; 75(1): 41-69.
- Osredkar J, Sustar N. Copper and zinc, biological role and significance of copper/zinc imbalance. J Clinic Toxicol. 2011; 3(1): 1-18.
- Zoidis E, Seremelis I, Kontopoulos N, Danezis GP. Selenium-dependent antioxidant enzymes: actions and properties of selenoproteins. Antioxidants 2018; 7(5): 1-26.
- Benvenga S, Feldt-Rasmussen U, Bonofiglio D, Asamoah E. Nutraceutical supplements in the thyroid setting: health benefits beyond basic nutrition. Nutrients 2019; 11(9): 1-19.
- Bianco AC, da Conceição RR. The deiodinase trio and thyroid hormone signaling. Methods Mol Biol. 2018; 1801: 67-83.
- Schrauzer, GN, Sacher J. Selenium in the maintenance and therapy of HIV-infected patients. Chem Bio Interact. 1994; 91(2-3): 199-205.
- Gornall AG, Bardawill CJ, David MM. Determination of serum proteins by means of the biuret reaction. J Biol Chem. 1949; 177(2): 751-66.
- Doumas BT, Wastson WA, Biggs HG. The human version is human serum albumin. Clin Chim Acta. 1971; 3(1): 87-96.
- Khatri S, Amatya A, Shrestha B. Nutritional status and the associated factors among people living with HIV: an evidence from cross-sectional survey in hospital based antiretroviral therapy site in Kathmandu, Nepal. BMC Nutr. 2020; 6(6): 1-13.
- Chinen J, Shearer WT. Secondary immunodeficiencies, including HIV infection. J Allergy Clin Immunol. 2010; 125(S2): 12-22.
- Wadgera NY, Yadhav ML, Nagaraja BS. C-reactive protein as an early marker of opportunistic infections in HIV. Int J Pharm Biol Sci. 2012; 3(4): 1194-203.
- Patil R, Raghuwanshi U. Serum protein, albumin, globulin levels, and A/G ratio in HIV positive patients. Biomed Pharmacol J. 2009; 2(2): 321-25.
- Daniel M, Mazengia F, Birhanu D. Nutritional status and associated factors among adult HIV/AIDS clients in Felege Hiwot Referral Hospital, Bahir Dar, Ethiopia. Sci J Public Hlth. 2013; 1(1): 24-31.
- Shivaji PM, Ramesh JV. To assess some special plasma proteins in HIV positive patients. Int J Biotechnol Biochem. 2018; 14(1): 65-70.
- Sicotte M, Bemeur C, Diouf A, Zunzunegui MV, Nguyen VK. Nutritional status of HIV-infected patients during the first year HAART in two West African cohorts. J Health Popul Nutr. 2015; 34(1): 1-10.
- O'Bryan T, Freiberg M, Tracy R, Okulicz J, Lalani T, Ganesan A, et al. Relationship of albumin/globulin ratio with biomarkers of inflammation and coagulation in HIV-infected persons before and after combination antiretroviral therapy. Open Forum Infect Dis. 2016; 3(1): 1.
- Akinpelu OO, Aken’Ova YA, Arinola, OG. Levels of immunoglobulin classes are not associated with severity of HIV infection in Nigerian patients. World J AIDS. 2012; 2(3): 232-36.
- Amare B, Tafess K, Moges F, Moges B, Yabutani T. Levels of serum zinc, copper and copper/zinc ratio in patients with diarrhea and HIV infection in Ethiopia. Vitam Trace Element 2011; 1(1): 1-5.
- Abd Elatif MA, Hassan EE, Bakhit SM, Modawe GA, Shrif NEMA. Assessment of plasma zinc and copper levels among sudanese HIV patients in Khartoum State. Int J Adv Pharm Biol Chem. 2014; 3(1): 1-5.
- Iakovidis I, Delimaris I, Piperakis SM. Copper and its complexes in medicine: a biochemical approach. Mol Biol Int. 2011; 2011: 1-13.
- Kaur G, Subramanian S. Classification of the treble clef zinc finger: noteworthy lessons for structure and function evolution. J Sci Rep. 2016; 6(1): 1-8.
- Benjamin R, Banerjee A, Balakrishnan K, Sivangala R, Gaddam S. Mycobacterial and HIV infections up-regulated human zinc finger protein 134, a novel positive regulator of HIV-1 LTR activity and viral propagation. PLoS One 2014; 9(1): 1-11.
- Baum MK, Shor-Posner G, Campa A. Zinc status in human immunodeficiency virus infection. J Nutr. 2000; 130(5): 1421-423.
- Gavrila A, Tsiodras S, Doweiko J, Nagy GS, Brodovicz K. Exercise and vitamin E intake are independently associated with metabolic abnormalities in human immunodeficiency virus? positive subjects: a cross-sectional study. Clin Infect Dis. 2003; 36(12): 1593-601.
- Gebrezgabher BB, Kebede Y, Kindie M, Tetemke D, Abay M, Gelaw YA. Determinants to antiretroviral treatment non-adherence among adult HIV/AIDS patients in northern Ethiopia. J AIDS Res Ther. 2017; 14(1): 1-7.


 , Innocent Ikechi Ogbu

