Enter your email address
Submit


Determination of Fasting Blood Sugar and Cholesterol
Levels in Gotvand City
Hoshang Roshanmehr1* M.Sc., Morad Rostami2 M.Sc., Maryam
Seyedtabib3 Ph.D., Naser Kamyari4 Ph.D.
1 Department of Biochemistry, Dezful University of Medical Sciences, Dezful, Iran
2 Department of Biochemistry, Ahvaz Jundishapur University of Medical Sciences, Ahvaz, Iran
3 Department of Biostatistics & Epidemiology, School of Public Health, Ahvaz Jundishapur University of Medical Sciences, Ahvaz, Iran
4 Department of Biostatistics, School of Public Health, Student Research Committee, Hamadan University of Medical Sciences, Hamadan, Iran
|
|
A B S T R A C T |
|
Article history Received: 3 Apr 2020 Accepted: 27 May 2020 Available online: 30 Nov 2020 Keywords Cholesterol Diabetes Fasting blood sugar Impaired fasting glucose |
Background and Aims: Due to the high prevalence of carbohydrate and lipid metabolism disorders worldwide and in Iran and as recommended by the international diabetes federation, about more investment in diabetes research in Iran, it is decided to perform of this study in the urban and rural area of Gotvad city in the Khuzestan Province of Iran. Materials and Methods: In this cross-sectional study, among 31822 eligible people, 4138 people aged 29 years or more participated between November 2017 and March 2018. Samples were obtained from patients, and after centrifugation and separation of serum, fasting blood sugar (FBS) and total cholesterol were measured employing the Glucose and Cholesterol Assay Kit of Pars Azmun Company. Since FBS and cholesterol statuses are ordinal, an ordinal logistic regression proportional odds model was used to identify the risk factors of responses if the proportional odds assumption satisfies. Univariate analysis was performed with independent t-test and ANOVA with a Tukey post-hoc. Results: Two models were determined, and except the area in predicting cholesterol status; all other covariates, including age, FBS value, cholesterol value, sex, and area in predicting FBS, were the significant predictors of cholesterol and FBS levels. Conclusions: Although there where a high prevalence of FBS and cholesterol level disturbances, from 24.9% and 25.9% of the population with disturbances in serum cholesterol and glucose levels, respectively, nearly 80% and 25.9% of them are in the borderline high group and impaired fasting glucose states, respectively which can return them to a healthy state with appropriate and prompt interventions. |
Introduction
Diabetes mellitus is one of the significant health problems in developing countries [1]. Diabetes is the fourth or fifth cause of death in most high-income countries and one of the world’s greatest health challenges [2]. Diabetes mellitus and a milder form of it, glucose intolerance, are found in almost the entire world [3]. Diabetes mellitus has complications that can reduce the quality of life in these patients [4, 5]. Diabetic patients are often hospitalized four times more than other people [6].
The prevalence of diabetes has increased significantly over the past two decades [1]. According to the International Federation of Diabetes (IDF) report, the number of patients with diabetes in 2015 was estimated to be 415 million and expected to reach 642 million worldwide by 2040 [7]. The number of people with impaired glucose tolerance (IGT) will increase to 472 million by 2030, which will comprise 8.4% of the world’s adult population [8].
According to the World Health Organization/ American Diabetes Association criteria for the diagnosis of diabetes mellitus, fasting serum glucose was considered ≥126 mg/dl. Also, fasting serum glucose between 100-125 mg/dl was considered as IFG (is a fasting glucose level between those of normal and diabetic individuals) [9, 10]. Individuals with IFG are at high risk of progressing to diabetes. Moreover, they are at increased risk of developing cardiovascular disease (CVD) [10].
Iran has taken third place in the Middle East and North Africa Region to have the highest adult population with diabetes [11]. According to the latest estimation, 9.1% (35.4 million) of the adult population in the Middle East and North Africa region has diabetes and is expected to nearly double by 2035 [11, 12]. Health costs spent on diabetes are 11.6% and 8.6% in the world, and in Iran, respectively [4, 6]. IDF has recommended that Iran needs more diabetes research [13].
CVD is another primary global health concern prevalent globally and is recognized as one of the most critical health threats to humans [14]. Hyperlipidemia is one of the main risk factors for the development of CVD [15].
Blocked coronary arteries and atherosclerosis will commence coronary artery disease via precipitating cholesterol, calcium, or producing cellular lesions and other substances in the arteries’ inner layers, together with the formation of connective tissue called plaque atherosclerosis [16]. Atherosclerosis is a process of hardening of the arteries due to cholesterol deposition in the arterial wall, which causes narrowing of the arteries. Atherosclerosis and atherosclerotic disorders such as coronary, cerebrovascular, and peripheral vascular diseases in the presence of hyperlipidemia have been accelerated [17]. Atherosclerosis can cause coronary artery ischemia and cause mortality [18]. The positive and healthy relationship has been thoroughly proven between total serum cholesterol and CVD risk [19].
According to estimations, CVD is responsible for about 40 to 45 percent of deaths [14]. CVD accounts for one-third of all deaths. CVDs are believed to be responsible for the leading cause of death and disability of people in 2020 [18-21]. 25% of people with atherosclerosis, without any symptoms, die suddenly or with a heart attack [22].
Recently, with the changing lifestyle, namely the industrialization and changing diets and the reduction of physical activity, the prevalence of hyperlipidemia is also increasing [19]. Almost many of the agents that cause diabetes and hyperlipidemia are overlapped. Hence, interventions that alter these conditions diminish glucose and cholesterol levels and directly affect raising the level of life quality of the community.
In the present study, a part of screening for the promotion of population health was carried out in comprehensive health care centers in the urban and rural people of Gotvand’s city in the Khuzestan province of Iran. The serum concentration of glucose and cholesterol was measured in people over 29 years to detect definite cases of hyperglycemia and hypercholesterolemia.
Materials and Methods
This cross-sectional study was done between November 2017 and March 2018 to measure fasting serum glucose and cholesterol levels in individuals aged 29 years and higher in Gotvand city in Khuzestan Province in Iran. It should be mentioned that 4138 people participated in this study.
Gotvand County has five towns and 34 villages and 26123 and 43404 urban and rural populations, respectively, that 12288 and 19534 of those in urban and rural areas were eligible for participation in this screening study.
Of those in urban areas, 12288 people and in rural areas, 19534, were eligible for participation in this screening study. The relevant individuals were identified based on the household number and information on the Sib system (Integrated Health System) of the Iranian Ministry of Health. They were then informed through personal referrals to health centers, referring family physicians to rural centers during weekly monitoring, installing the banner in the health centers of cities, villages, and health homes, through the people living in a neighborhood and referred to participate in this screening study. After referring to one of the health centers, these people received a referral form and were informed about the sampling conditions (such as 8-12 hours of fasting). The sampling unit was referred to in the same center and venipuncture was done by trained personnel on the date entered in the form.
Samples (5 mL of venous blood in the fasting state) were collected from the rural and urban centers from each person and transferred (at a temperature of 2-4˚C) within 2 hours of sampling to the contracting laboratory in Gotvand city. Samples were centrifuged immediately after receiving 2000×g for 10 minutes [23], and their serum was separated and removed. Immediately, glucose and cholesterol tests were performed.
At the beginning of each working day, the accuracy of the biochemical auto analyzer Sinnowa was evaluated using serum samples at low, normal, and high values, and tests were carried out after assuring the device’s calibration. Serum glucose levels were measured employing Glucose Assay Kit, Enzymatic-Colorimetric method (GOD-PAP; Glucose oxidase-phenol, and four amino-phenazone), and serum cholesterol levels were measured using Cholesterol Assay Kit, Enzymatic-Colorimetric method (CHOD-PAP; Cholesterol oxidase phenol 4-amino antipyrine peroxidase) from Pars Azmun company. The fasting blood sugar (FBS) level was categorized as Normal: < 99 mg/dl, IFG: 100-125 mg/dl and diabetes: ≥ 126 mg/dl [9].
The cholesterol level was categorized as desirable: < 200 mg/dl, borderline high: 200-239 mg/dl and high: ≥ 240 mg/dl [9].
Statistical analysis
Univariate analysis was performed with an independent t-test and ANOVA with a Tukey post-hoc. P<0.05 was considered as significant and an ordinal logistic regression proportional odds model (POM) was used to identify the risk factors of responses if the proportional odds assumption satisfies. This study is approved by the Ethics Committee of Dezful University of Medical Sciences, Dezful, Iran.
Results
Socio-demographic, FBS, and the participants’ cholesterol characteristics are given in Table 1. In all participants, 71.5% were female, and 58.8% of residents in urban regions. The participants’ age range was between 19 to 98 years, and the mean (SD) of age was 50.86 (13.17). In categorized age, participates have more frequency with the age range between 39 to 49 years. Descriptive statistics include mean, standard deviation, range, median, and frequencies (%) of FBS and cholesterol are shown in Table 1. Mean (SD) of FBS and cholesterol were 100.07 mg/dl (36.84) and 176.43 mg/dl (35.31), respectively. In the categorized version of FBS and cholesterol, participants are more in first levels (≤99 for FBS, ≤199 for cholesterol).
Comparing the mean of cholesterol in level of variables (sex, categorical age, area, and FBS level) is given in Table 2. Except for area (p=0.115), all groups have a significant difference in the mean of cholesterol. After the ANOVA test, a post-hoc (Tukey) test was calculated to find significant paired groups in age and FBS levels.
Comparing the mean of FBS in the level of variables (sex, categorical age, area, and cholesterol level) is given in Table 3. Except for sex (p=0.320), all groups have a significant difference in the mean of FBS. After the ANOVA test, a post-hoc (Tukey) test was calculated to find significant paired groups in age and FBS levels.
To identify cholesterol and FBS's risk factors, the study fitted the POM separately to each response. At first, the models' competence is defined, and then the results of the models are interpreted.
Proportional odds model
The results of the multiple POM’s are given in Table 4 and Table 5. Except for the area in POM of cholesterol, all the considered variables in two POM’s are significant. The proportional odds assumption's score test is found insignificant at 5% level of significance, indicating the data satisfy the proportional
odds assumption. Single score tests of the proportional odds assumption for each covariate were conducted to confirm the conclusion regarding POM's assumption. The test results reveal that all the variables were found insignificant, i.e., satisfy the proportional odds assumption.
The score test for the proportional odds assumption yielded p=0.403, indicating that the model is appropriate for the data. The proportional odds model shows that except area, all other covariates have a significant positive effect according to the Wald test with p<0.001.
An increase in age was associated with an increase in the odds of the high level of cholesterol, with an odds ratio of 1.015 (95% CI, 1.010 to 1.021), Wald χ2 (1) = 29.73, p < 0.001. An increase in FBS was associated with an increase in the odds of the high level of cholesterol, with an odds ratio of 1.005 (95% CI, 1.004 to 1.007), Wald χ2 (1)= 36.45, p<0.001.
Since this interval does not contain the value 1 corresponding to the null hypothesis of independence, it also follows that age and FBS influence the cholesterol level. The results of POM reveal that the risk of having high cholesterol was 1.355 times higher among the females compared to the males (Table 4).
The score test for the proportional odds assumption yielded p=0.361, indicating that the model is appropriate for the data. The proportional odds model shows that except area (󠆿β= - 0.443, p<0.001), all other covariates have a positive and significant effect according to the Wald test with p < 0.05.
Results show that an increase in age was associated with an increase in the odds of the high level of FBS, with an odds ratio of 1.044 (95% CI, 1.038 to 1.050), Wald χ2 (1) = 246.84, p< 0.001. An increase in cholesterol was associated with an increase in the odds of FBS's high level, with an odds ratio of 1.003 (95% CI, 1.001 to 1.005), Wald χ2 (1)= 8.89, p= 0.024.
Since this interval does not contain the value 1 corresponding to the null hypothesis of independence, it also follows that age and FBS influence the FBS level. The results of POM reveal that the risk of having high FBS was 1.203 times higher among the females compared to the males, and the risk of having high FBS was 1.558 times higher among the urban compared to the rural (Table 5).
The plot of the cumulative probabilities of FBS and cholesterol status versus age, FBS, and cholesterol values estimated from the proportional odds model is shown in Figure 1. Figure 1 gives an intuitive impression of how the probability of high FBS and high cholesterol increases with increasing age, FBS, and cholesterol levels. The individual score test also reveals this picture.
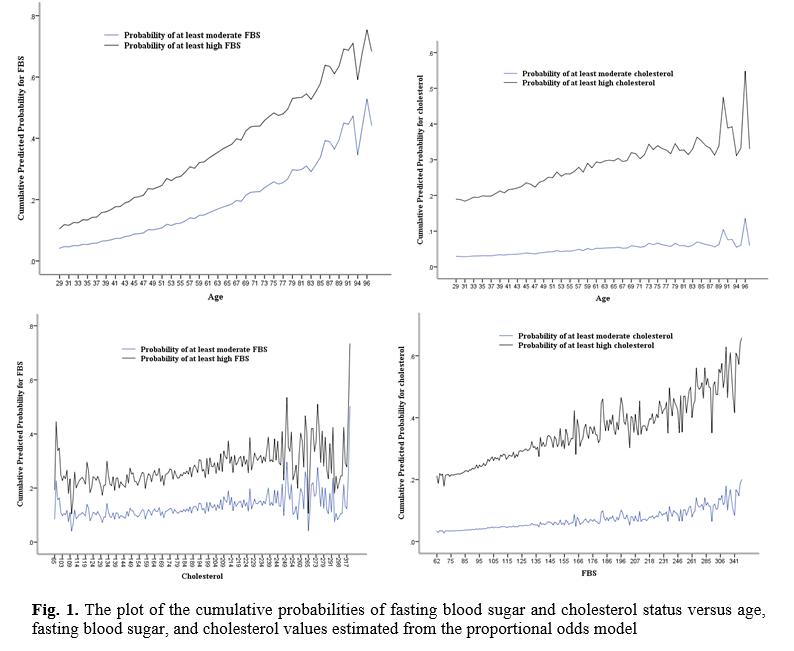
Table 1. Socio-demographic, FBS, and cholesterol characteristics of the participants
|
Socio-demographic characteristics |
N |
% |
Interval |
Median |
Mean |
SD |
|
|
Sex |
Male |
1181 |
28.5 |
|
|
|
|
|
|
Female |
2957 |
71.5 |
|
|
|
|
|
Age (year) |
Male |
1181 |
28.5 |
29 - 98 |
51.0 |
52.62 |
13.64 |
|
|
Female |
2957 |
71.5 |
29 - 96 |
48.0 |
50.16 |
12.92 |
|
|
Total |
4138 |
100.0 |
29 - 98 |
49.0 |
50.86 |
13.17 |
|
Age (categorized) |
29 – 38 |
922 |
22.3 |
|
|
|
|
|
|
39 – 48 |
1181 |
28.5 |
|
|
|
|
|
|
49 – 58 |
954 |
23.1 |
|
|
|
|
|
|
59 – 69 |
690 |
16.7 |
|
|
|
|
|
|
≥ 70 |
391 |
9.4 |
|
|
|
|
|
Area |
Rural |
1705 |
41.2 |
|
|
|
|
|
|
Urban |
2433 |
58.8 |
|
|
|
|
|
FBS (mg/dl) |
|
4138 |
100.0 |
62 - 376 |
89.0 |
100.07 |
36.84 |
|
FBS (categorized) |
≤ 99 |
3065 |
74.1 |
|
|
|
|
|
|
99 – 125 |
579 |
14.0 |
|
|
|
|
|
|
≥ 126 |
494 |
11.9 |
|
|
|
|
|
Cholesterol (mg/dl) |
|
4138 |
100.0 |
65 - 411 |
174.0 |
176.43 |
35.31 |
|
Cholesterol (categorized) |
≤ 199 |
3106 |
75.1 |
|
|
|
|
|
|
199 – 239 |
857 |
20.7 |
|
|
|
|
|
|
≥ 240 |
175 |
4.2 |
|
|
|
|
SD=Standard deviation; FBS=Fasting blood sugar
Table 2. Comparing the mean of cholesterol in level of variables, n=4138
|
Socio-demographic characteristics |
Mean ± SD |
|
|
|
Sex |
Male |
172.69 ± 34.22 |
T = 4.31, p< 0.001 |
|
|
Female |
177.92 ± 35.63 |
|
|
Age (categorized) (year) |
29 – 38 |
168.12 ± 32.70 |
F = 19.64, p <0.001 |
|
|
39 – 48 |
177.39 ± 33.70 |
|
|
|
49 – 58 |
181.60 ± 35.94 |
|
|
|
59 – 69 |
176.50 ± 37.11 |
|
|
|
≥ 70 |
180.34 ± 37.77 |
|
|
Area |
Rural |
175.39 ± 34.56 |
T = 1.58, p= 0.115 |
|
|
Urban |
177.15 ± 35.81 |
|
|
FBS (mg/dl) (categorized) |
≤ 99 |
174.93 ± 34.57 |
F = 11.06, p<0.001 |
|
|
(99 – 125] |
179.74 ± 35.45 |
|
|
|
≥ 126 |
181.80 ± 38.76 |
|
SD=Standard deviation; FBS=Fasting blood sugar
Table 3. Comparing the mean of FBS (mg/dl) in level of variables, n=4138
|
Socio-demographic characteristics |
FBS (Mean ± SD) |
P-value |
|
|
Sex |
Male |
99.16 ± 35.91 |
T = 0.99, p= 0.320 |
|
|
Female |
100.43 ± 37.21 |
|
|
Age (categorized) (year) |
29 – 38 |
89.04 ± 23.01 |
F = 52.54, p<0.001 |
|
|
39 – 48 |
95.07 ± 30.31 |
|
|
|
49 – 58 |
106.77 ± 42.43 |
|
|
|
59 – 68 |
109.53 ± 44.23 |
|
|
|
≥ 70 |
107.95 ± 42.64 |
|
|
Area |
Rural |
96.30 ± 33.62 |
T = 5.52, p< 0.001 |
|
|
Urban |
102.70 ± 38.73 |
|
|
Cholesterol (categorized) (mg/dl) |
≤ 199 |
97.61 ± 33.16 |
F = 31.92, p<0.001 |
|
|
199 – 239 |
105.98 ± 44.37 |
|
|
|
≥ 240 |
114.54 ± 50.448 |
|
SD=Standard deviation; FBS= Fast blood sugar
Table 4. Results of the proportional odds model using cholesterol level (mg/dl) with three ordered categories, n=4138
|
Covariate |
Logistic coefficient |
Standard error |
Wald |
p-value |
Odds ratio |
95% Confidence Interval |
Single score test (p-value) |
|
|
Lower |
Upper |
|||||||
|
Intercept 1 |
2.624 |
0.180 |
212.106 |
< 0.001 |
|
|
|
|
|
Intercept 2 |
4.671 |
0.196 |
566.994 |
< 0.001 |
|
|
|
|
|
Age (Year) |
0.015 |
0.003 |
29.648 |
< 0.001 |
1.015 |
1.010 |
1.021 |
0.785 |
|
FBS (mg/dl) |
0.005 |
0.001 |
36.450 |
< 0.001 |
1.005 |
1.004 |
1.007 |
0.372 |
|
Sex (female) |
0.304 |
0.083 |
13.472 |
< 0.001 |
1.355 |
1.153 |
1.596 |
0.290 |
|
Area (rural) |
-0.041 |
0.074 |
0.305 |
0.5810 |
0.959 |
0.830 |
1.109 |
0.143 |
FBS=Fasting blood sugar. Score test for the proportional odds assumption: Chi-square = 4.024, df = 4, p-value=0.403. Goodness-of-fit test of overall model (Likelihood Ratio): Chi-square = 92.28, df = 4, p-value < 0.001, Pseudo R2 (Cox and Snell) = 0.022
Table 5. Results of the proportional odds model using FBS level (mg/dl) with three ordered categories, n=4138
|
Covariate |
Logistic coefficient |
Standard error |
Wald Chi-square |
P-value |
Odds ration |
95% Confidence Interval |
Single score test (p-value) |
|
|
Lower |
Upper |
|||||||
|
Intercept 1 |
3.817 |
0.239 |
254.145 |
< 0.001 |
|
|
|
|
|
Intercept 2 |
4.823 |
0.245 |
388.741 |
< 0.001 |
|
|
|
|
|
Age (Year) |
0.043 |
0.003 |
246.843 |
< 0.001 |
1.044 |
1.038 |
1.050 |
0.636 |
|
Cholesterol (mg/dl) |
0.003 |
0.001 |
8.888 |
0.0033 |
1.003 |
1.001 |
1.005 |
0.870 |
|
Sex (female) |
0.184 |
0.082 |
5.071 |
0.0236 |
1.203 |
1.025 |
1.412 |
0.228 |
|
Area (rural) |
- 0.443 |
0.076 |
34.235 |
< 0.001 |
0.642 |
0.553 |
0.744 |
0.119 |
FBS=Fasting blood sugar. Score test for the proportional odds assumption: Chi-square = 4.345, df = 4, p-value=0.361. Goodness-of-fit test of overall model (Likelihood ratio): Chi-square = 319.59, df = 4, p-value < 0.001, Pseudo R2 (Cox and Snell) = 0.074
Discussion
In this study, 4138 people participated including 1181 (28.5%) men and 2957 (71.5%) women. The mean age of men and women were 52.62±13.64 and 50.16±12.92 years, respectively. 1705 people (41.2%) and 2433 people (58.8%) lived in rural and urbanized region (p= 0.115), respectively. 3065 (74.1%) individuals had normal blood glucose levels. Four hundred ninety-four cases (11.9%) were in the diabetic group, and 579 (14%) were in the IFG group. In other words, 1073 (25.9%) had a disturbance in blood glucose levels. In this study, the mean of serum glucose level in the whole of participants were 100.7±36.84 mg/dl.
Wild et al. estimated that the prevalence of diabetes in Iran would be 5.7% and 7% in 2000 and 2025, respectively [24]. As mentioned above, the prevalence of diabetes in this study was 11.9%, which is much higher than estimated by Wild et al, which probably reflects our society's acceleration towards a diminutive and westernized lifestyle ever-increasing use of western regimen diets [24-27].
The prevalence of diabetes among Iranian adults, between 1999 and 2007, nearly doubled [28]. In our study, age, blood cholesterol, and female sex variables had a positive (increase) effect on blood glucose levels, and only the variable of the rural area had a negative (decreasing) impact.
In the study of Esteghamati et al., the prevalence of diabetes was higher in women (12.86%) than men (9.90%), and in urban (12.69%) than rural (7.62%) residents. Furthermore, there was a 35% increase in the diabetes prevalence rate among Iranian adults from 2005 to 2011. Also, in Esteghamati and colleagues' study, the prevalence of IFG was considerably high (14.6%) [29].
In the study of Hadaegh et al., which was conducted on a population of 9519 people in Tehran, the prevalence of diabetes and IFG in men was 8.1% and 5.1%, and in women, it was 10% and 4.7%, respectively. As in the present study, the prevalence of diabetes was higher in women than in men. Also, in their research, about 40% of people did not know their diabetes; in other words, they had hidden diabetes [30].
In the study done by Larijani et al., the prevalence of diabetes in Tehran was 10.9% in 2003. In their study, the incidence of diabetes in women was higher than in men, which is consistent with this research [31].
In the study of Vaghari et al., the prevalence of diabetes in Golestan Province in 2010 was 8.3%. In their study, the prevalence of diabetes was higher in women (9.7%) than in men (6.8%) [32], which is in line with the current study. In the study of Mostafavi et al., the prevalence of diabetes in people over 30 years old in Mashhad city was 19.7% [33]. Contrary to our study, the prevalence of diabetes in men was significantly higher than that in women. In the study by Ramachadran et al., the prevalence of diabetes in the population aged 55-74 years in India was 15.6% [34].
In our study, the average serum blood glucose level in men was 99.16±35.91 mg/dl, and the average serum blood glucose level in women was 100.43±37.21 mg/dl, which this difference was not statistically significant. In our study, the serum blood glucose level increased to age 69 years, proportional to age (p˂0.001), but there was a decrease of 69 years and over. Several studies have pointed to an increased prevalence of diabetes with age [34-36]. It can be assumed that as the age increases, the level of mobility and activity of individuals also decreases, and with the increase in body mass index, the amount of sugar metabolism disorder may increase. The study by Baker et al. indicates physical inactivity in more than 80% of the urban population [37].
The average serum blood glucose level in the rural population was 96.30±33.62 mg/dl, and in the urban population, it was 102.70±38.73 mg/dl, which was not statistically significant. This finding coincided with our perceptions of rural people who have more physical activity and more mobility and have a more natural diet than urban people. In our study, 3106 people (75.1%) had normal cholesterol levels. 857 (20.7%) subjects were in the borderline high group, and 175 (4.2%) subjects were in the high group for serum cholesterol level. In other words, 1032 people (24.9%) had disturbances in cholesterol levels.
With increased cholesterol levels in individuals, serum glucose levels also increased. The mean serum glucose level in subjects with normal, borderline high, high cholesterol levels, blood glucose, was 97.61±33.16, 105.98±44.37, and 114.44±50.44 mg/dl. This difference was statistically significant. In our study, the mean serum cholesterol level in participants was 176.43±35.31 mg/dl (Median=174).
In the study of Azizi et al., which was done on 6246 people between 20-60 years old in Tehran city, the mean serum cholesterol level was 210±47 mg/dl [38]. In the study of Mellati et al., which was done on 2768 people between 21-75 years old in the Zanjan city, the mean serum cholesterol level was 186±41.7 mg/dl [39].
In most studies in various Iran areas, the mean serum cholesterol level was higher than our results (38-40), and only in a few studies, the mean serum cholesterol level was lower than our results. In the study of Saberi et al., that was done on people over 20 years old in the Rasht city, the mean serum cholesterol level was 152.9±37 mg/dl [41] that lower of their mean serum cholesterol level was probably due to lower age of their participants and sea regimen diet of people in the north area of the country. In the study of Asgari et al., that was done on 19017 people in 2007, and at the national level, the mean serum cholesterol level was 185.5±43.8 mg/dl [42] that was higher than the mean serum cholesterol level in our study. Changes in lifestyle due to industrialization have altered peoples’ diets and reduced their physical activity, leading to increased hyperlipidemia. A positive relationship has been indicated between the serum level of cholesterol and CVD risk [43].
Urban residents, lifestyle life, and diets effectively increase the level of cholesterol and glucose, and in our study, there was a correlation between blood glucose and cholesterol levels. On the other hand, a negative correlation was between rural residency and blood glucose and cholesterol levels due to more mobility and activity and healthier nutrition between rural populations.
In our study, age, blood glucose, and female sex variables had a positive (increase) effect on blood cholesterol levels, and only the variable of the rural area had a negative (decreasing) impact.
CVDs are regarded as the main cause of morbidity and mortality in patients with diabetes [44]. On the other hand, the positive and strong relationship has been fully proven between total serum cholesterol and CVD risk [19]. Given that our study found that blood glucose levels directly correlated with cholesterol levels, CVD could be considered one of the main causes of morbidity and mortality in diabetic patients.
According to estimates, CVD is responsible for about 40 to 45 percent of the causes of deaths [14]. CVD accounts for one-third of all deaths. CVDs are believed to be responsible for the main cause of death and disability of people in 2020 [18-19].
Results from one study demonstrated that the incidence rates of cardiovascular and coronary heart diseases are about 25 and 23 per 1000 person-years, respectively. In the study of Bozorgmanesh et al., the incidence rate of cardiovascular and coronary heart diseases was about 25 and 23 per 1000 person-years, respectively [45]. In the study of Faghih-Imani et al., the prevalence of myocardial infarction in diabetic patients in the Isfahan was 6.3% [46]. Also, in the study of Janghorbani et al., the prevalence of coronary heart diseases in diabetic patients in the Isfahan was 28% [47].
Iran has rapidly grown in urbanization and industrialization, which is in line with cultural, social, and economic changes over the last few decades. This fast transition, accompanied by changes in nutrition habits and physical activities; thus, the lifestyle is calm and sedentary, and frequent consumption of fast foods has become a significant part of daily habitual behaviors. Due to the results of these lifestyle and demographic changes, no communicable diseases such as diabetes and CVD are the principal causes of morbidity and mortality [48]. Increasing prevalence of diabetes, elevated levels of homocysteine and markers of lipid peroxidation, high blood pressure, low high-density lipoprotein levels, elevated triglycerides, Lipoprotein α, and small dense lipoprotein particles, as the factors involved in the CVD cases have been reported [49]. So in the years to come, with more immigration from the countryside and the adoption of urban living, non-life-threatening and lifestyle-related diseases would happen, such as diabetes and hyperlipidemia that can lead to some complication such as CVD, and can reduce the quality of life in these patients [4-5] leading to the imposition of health costs on governments [4, 6]. Therefore, planning for a lifestyle change and diet to prevent such a disease is essential and requires an immediate effort done by health ministry by educating people through television programs, newsletters, and health centers.
About one-fourth of the people with diabetes were not previously diagnosed with diabetes and were unaware of their illness [44]. Therefore, they did not take any treatment and are at high risk of diabetes and disability complications. Consequently, to gain desirable consequences, prevent complications of high serum glucose and cholesterol levels for patients and decrease morbidity and mortality among their patients, to reduce the imposition of health costs on governments and health systems, a suitable program should be designed to detect individuals with high serum glucose and cholesterol levels early for prompt management and treatments.
In this study, from 24.9% population with disturbances in serum cholesterol levels, nearly 80% of them are in the borderline high group, and from 25.9% population with disorders in serum glucose levels, almost 54% of them are in the IFG state, which can return them to a healthy state with appropriate interventions.
Conclusion
Despite the high prevalence of FBS and cholesterol level disturbances, in 24.9% and 25.9% of the population have disturbances in serum cholesterol and glucose levels. In this study, nearly 80% and 25.9% of them are in the borderline high group and impaired fasting glucose states, respectively; that can, fortunately, return to a healthy state with appropriate and prompt interventions.
Conflict of Interest
The authors decline that there is no conflict of interest.
Acknowledgments
The Ministry of Health of Iran did the financial part of this project. We gratefully acknowledge all employees assisting in this project.
References
[1]. Abrishami Z, Nasli-Esfahani E, Razmandeh R, Larijani B, Bandarian F. Iran diabetes research roadmap (IDRR) study; Gap analysis of diabetes complications in Iran: A review article. Iran J Public Health 2017;46(1): 32-8.
[2]. Teljeur C, Moran PS, Walshe S, Smith SM, Cianci F, Murphy L, et al. Economic evaluation of chronic disease self-management for people with diabetes: a systematic review. Diabet Med. 2017; 34(8): 1040-1049.
[3]. World Health Organization. Department of Non-communicable Disease Surveillance. Definition, diagnosis and classification of diabetes mellitus and its complications. Geneva, Switzerland: 1999.
[4]. Nasli-Esfahani E, Farzadfar F, Kouhnavard M, Ghodssi-Ghassemabadi R, Khajavi A, Peimani M, et al. Iran diabetes research roadmap (IDRR) study: a preliminary study on diabetes research in the world and Iran. J Diabetes Metab Disord. 2017; 16(1): 19.
[5]. Litwak L, Goh SY, Hussein Z, Malek R, Prusty V, Khamse ME. Prevalence of diabetes complications in people with type 2 diabetes mellitus and its association with baseline characteristics in the multinational a1chieve study. Diabetol Metab Syndr. 2013; 5(1): 57.
[6]. Ghaffari S, Hashemi SE, Atabaki H. The national financial burden of hospitalization of diabetes in Iran. J Clin Res Governance. 2012; 1(1): 6.
[7]. International Diabetes Federation. IDF Diabetes Atlas. 7th ed. Brussels, Belgium: International Diabetes Federation; 2015.
[8]. Sicree R, Shaw J, Zimmet P. The global burden. diabetes and impaired glucose tolerance. prevalence and projections. In: Gan, D. Diabetes Atlas. 3rd ed. Brussels: Int Diabet Feder; 2006: 16-103.
[9]. Wu Allan HB. Tietz clinical guide to laboratory tests. 4th ed. USA: W.B. Saunders; 2006.
[10]. Rifai N, Horvath AR, Wittwer CT. Tietz textbook of clinical chemistry and molecular diagnostics. 6th ed. USA: Elsevier; 2018.
[11]. Rahelic D. IDF diabetes atlas-call for immediate action. 7th ed. Lijec Vjesn; 2016. 138(1-2): 57-8.
[12]. Guariguata L. Contribute data to the 6th edition of the IDF Diabetes Atlas. Diabetes Res Clin Pract. 2013; 100: 280-81.
[13]. Rasolabadi M, Khaledi S, Ardalan M, Kalhor MM, Penjvini S, Gharib A. diabetes research in Iran: a scientometric analysis of publications output. Acta Inform Med. 2015; 23(3): 160-64.
[14]. Hassankhani H, zhinalzadeh A, Fakhri M, Asadi P, Almasi A. Shift work and cardio-vascular risk factors in the nurses of the emergency and intensive care wards of educational hospitals affiliated to Kermanshah University of Medical Sciences in 2012-2013. J Clin Res Paramed Sci. 2012; 1(3): 55-64.
[15]. Shattat GF. A review article on hyperlipidemia: types, treatments and new drug targets. Biomed Pharmacol J. 2014; 7(2): 399-409.
[16]. Ghatresamani K, Roghani F, Farokhi A. Evaluation of correlation between plasma homocysteine and oxidized low-density lipoprotein in patients with coronary artery disease. J Birjand Univ Med Sci. 2009; 16(3): 47-53.
[17]. Wells GB, Dipiro J, Schwinghammer T, Hamilton C. Pharmacotherapy Handbook, 7th ed. USA, the McGraw Hill Companies: 2007; p.98-108.
[18].Aghakhani N, Sharif Nia H, Shamabadi GH, TaGhipour B, Nikoonejad AR. Survey of the relationship between cardiovascular risk factors and result of exercise test on patients referring to a hospital in Urmia in 2009. J Commun Health. 2014; 7(4): 53-61.
[19]. Shahebrahimi K, Mirmiran P, Habibi Moieni AS, Ghanbili J, Momenan A, Momenan A, et al. Assessment of changes in lipid levels after 3 years Tehran lipid and glucose study. Res Med. 2006; 4(30): 267-77.
[20]. Ginghina C, Bejan I, Ceck CD. Modern risk stratification in coronary heart disease. J Med Life. 2011;4(4): 377-86.
[21]. Jorgensen T, Capewell S, Prescott E, Allender S, Sans S, Zdrojewski T. Population-level changes to promote cardiovascular health. Eur J Prev Cardiol. 2013; 20(3): 409-21.
[22]. Majdi MR, Nikparast N, Bagherzadeh A, Puradine M, Sabery-Karimian M, Khani H, et al. Prevalence of hyperlipidemia and some effective factors in teachers of North Khorasan province. Journal of North Khorasan University of Medical Sciences 2012; 4(1): 67-70.
[23]. Gudar WG, Narayanan S. Pre-examination procedures in laboratory diagnostics. Germany: CPI books GmbH, Leck; 2015.
[24]. Wild S, Roglic G, Green A, Sicree R, King H. Global prevalence of diabetes: estimates for the year 2000 and projections for 2030. Diabet Care. 2004; 27(3): 1047-1053.
[25].Ghassemi H, Harrison G, Mohammad K. An accelerated nutrition transition in Iran. Public Health Nutr. 2002; 5:149-55.
[26]. Sheikholeslam R, Mohamad A, Mohammad K, Vaseghi S. Non-communicable disease risk factors in Iran. Asia Pac J Clin Nutr. 2004; 13(S 2): 1-2.
[27]. Kelishadi R, Ardalan G, Gheiratmand R, Gouya MM, Razaghi EM, Delavari A, et al. Association of physical activity and dietary behaviours in relation to the body mass index in a national sample of Iranian children and adolescents: Caspian study. Bull World Health Organ 2007; 85(1): 19-26.
[28]. Sarayani A, Rashidian A, Gholami K. Low utilisation of diabetes medicines in Iran, despite their affordability (2000-2012): a time-series and benchmarking study. BMJ Open 2014; 16: 4(10): e005859.
[29]. Esteghamati A, Etemad K, Koohpayehzadeh J, Abbasi M, Meysamie AP, Noshad S, et al. Trends in the prevalence of diabetes and impaired fasting glucose in association with obesity in Iran: 2005-2011. Diabet Res Clin Pract. 2014; 103(3): 319-327.
[30].Hadaegh F, Bozorgmanesh M, Harati H, Saadat N, Azizi F. High prevalence of diabetes and abnormal glucose tolerance in urban Iranians aged over 20 years: Determining an effective screening strategy for un-diagnosed diabetes. IJEM 2008; 9(4): 383-91.
[32]. Veghari G, Sedaghat M, Joshaghani HR, Hoseini A, Niknajad F, Angizeh A, et al. Assessment of diabetes mellitus type ii and some related factors among adult people aged 25-65 years old in Golestan Province, Iran. J Res Dev Nurs Midwif. 2010;7(1):10-19.
[33]. Mostafavi Z, Mostafavian Z. Prevalence of diabetes type 2 and relationship of it with anthropometric measures in urban population of Mashhad during 2011-2013. Journal of Medical Science of Islamic Azad University of Mashhad 2015; 2(2): 1-10.
[34]. Ramachadran A, Snehalatha C, Satyavani K, Vijay V. Impaired fasting glucose and impaired glucose tolerance in urban population in India. Diabet Med. 2003; 20(4): 220-24.
[35]. Jaber LA, Brown MB, Hammad A, Nowak SN, Zhu Q, Ghafoor A, et al. Epidemiology of diabetes among Arab Americans. Diabet Care. 2003; 26(2): 308-13.
[36]. Ozdemir L, Topcu S, Nadir I, Nur N, Arslan S, Sumer H. The prevalence of diabetes and impaired glucose tolerance in Sivas, Central Anatolia, Turkey. Diabet Care. 2005; 8(4): 795-98.
[37].Baker DW, Sudano JJ, Albert JM, Borawski EA, Dor A. Lack of health insurance and decline in overall health in late middle age. N Engl J Med. 2001; 345(15): 1106-112.
[38]. Azizi F, Rahmani M, Ghanbarian A, Emami H, Salehi P, Mirmiran P, et al. Serum lipid levels in an Iranian adults population: Tehran lipid and glucose study. Eur J Epidemiol. 2003; 18(9): 311-19.
[39]. Mellati AA, Mousavinasab SN, Sokhanvar S, Kazemi SA, Esmailli MH, Dinmohamadi H. Correlation of anthropometric indices with common cardiovascular risk factors in an urban adult population of Iran: data from Zanjan Healthy Heart Study. Asia Pac J Clin Nutr. 2009; 18(1): 217-25.
[40]. Kelishadi R, Gharipour M, Sadri GH, Tavasoli AA, Amani A. Cardiovascular disease risk factors, metabolic syndrome and obesity in an Iranian population. East Mediterr Health J. 2008; 14(5): 1070-79.
[41]. Saberi A, Hatamian HR, Kazemnejad E, Ghorbannejad N. Hyperlipidemia in migraine: Is it more frequent in migraineurs? Iran J Neurol. 2011;10(3-4): 46-50.
[42]. Asgari F, Mirzazadeh A, Heidaria H. Iran-non-communicable diseases risk factors surveillance- Data book for 2007. Tehran: Chakameh Ava Group; 2009: p. 1-82.
[43]. Akbartabar Toori M, Kiani F, Sayehmiri F, Sayehmiri K, Mohsenzadeh Y, Ostovar R, et al. Prevalence of hypercholesterolemia, high LDL, and Low HDL in Iran: A systematic review and meta-analysis. IJMS 2018; 43(5): 449-65.
[44]. American Diabetes Association. Cardiovascular disease and risk management. Diabet Care. 2015; 38(S 1): 49-57.
[45]. Bozorgmanesh M, Hadaegh F, Sheikhol-eslami F, Azizi F. Cardiovascular risk and allecause mortality attributable to diabetes: Tehran lipid and glucose study. J Endocrinol Invest. 2012; 35(1): 14-20.
[46]. Faghih-Imani E, Amini M, Adibi P. Silent ischemia in type I diabetic patients: a study of EKG changes. Arya Atherosclerosis J. 2005; 1(2): 89-93.
[47]. Janghorbani M, Amini M, Tavassoli A. Coronary heart disease in type 2 diabetes mellitus in Isfahan, Iran: prevalence and risk factors. Acta Cardiol. 2006; 61(1): 13-20.
[48]. Noshad S, Afarideh M, Heidari B, Mechanick JI, Esteghamati A. Diabetes Care in Iran: Where we stand and where we are headed. Ann Glob Health. 2015; 81(6): 839-50.
[49]. Rostami M, Aberomand M, Khirollah A, Jorfi M. Evaluation of serum iron and ferritin levels in myocardial infarction patients. Journal of Bioinformatics and Intelligent Control 2013; 2(1): 79-82.
| Rights and permissions | |
 |
This work is licensed under a Creative Commons Attribution-NonCommercial 4.0 International License. |


