Procalcitonin is a peptide belonging to the calcitonin superfamily, with a molecular weight of 14.5 kDa, consisting of 116 amino acids. It is encoded by the calcitonin gene-dependent peptide 1 gene on chromosome 11. The initial product of this gene, the 141 amino acid long peptide known as preprocalcitonin, is proteolytically degraded to form the procalcitonin molecule. Eventually, calcitonin is created, which consists of 32 amino acids. Thyroid gland C cells are responsible for all procalcitonin and calcitonin synthesis since calcitonin gene-dependent peptide 1 gene transcription is suppressed in non-neuroendocrine tissues under physiological conditions [1]. At the end of the 1980s, it was determined that procalcitonin increased bacterial infections and sepsis, and it started to be used for diagnostic purposes [2]. The stimulating effect of bacterial lipopolysaccharides increases serum procalcitonin concentrations in cases of systemic infection. It has been shown that in cases of inflammation and sepsis, procalcitonin is synthesized in various tissues, especially in the liver and in mononuclear cells [1].
Procalcitonin assay is considered a convenient method for diagnosing and managing sepsis, especially in the emergency department and intensive care units, and its use is increasing. Procalcitonin has a substantial diagnostic accuracy for bacteremia in suspected infection or sepsis patients. In addition, low procalcitonin levels can exclude the presence of bacteremia. Procalcitonin levels greater than 0.5 ng/ml are considered a potent marker of bacterial infection. If it is higher than 2.0 ng/ml, it indicates the presence of systemic infection. It is recommended to repeat the procalcitonin analysis after 6-24 hours in suspected sepsis [3]. Values above 10 ng/ml indicate severe sepsis or septic shock. Rapid diagnosis and management of systemic bacterial infections are critical for the course of the disease. Distinguishing whether the condition is bacterial or viral and systemic or localized is decisive for treatment options [4].
This study aimed to compare the ADVIA Centaur® BRAHMS serum procalcitonin method, which is routinely used in the Medical Biochemistry laboratory of the Uşak Training and Research Hospital, and the Getein Biotech serum procalcitonin point of care method, which was established in the laboratory for method verification.
Materials and Methods
Ethical considerations
The study was performed on leftover samples that were anonymized and de-identified; thus, no informed consent was required. As this research is a quality improvement project according to the institutional review board policy, Research and Development Commission of Uşak Training and Research Hospital approval was received for this study (Approval number: E-45786011-602.03.99).
Settings
The method comparison study was performed based on EP9-A3 [5] and EP15-A2 [6] protocols published by Clinical Laboratory Standards Institute (CLSI). Accordingly, it is recommended that at least 40 cases should be collected for method comparison, some of them should be outside the reference range, and the study should be performed in at least five days.
Serum procalcitonin assays were performed on the “Advia Centaur® XP analyzer” using the “ADVIA Centaur® BRAHMS Procalcitonin kit” (Siemens Healthcare Diagnostics Inc, USA) and on the “Getein 1600 point-of-care test analyzer” using the “Getein procalcitonin Fast Test Kit” (Getein Biotech Inc, China). The samples were randomly selected from the requests made from the out-patient clinic and services of the hospital. Venous blood samples were collected in vacuum serum separator tubes (BD Vacutainer SST II Advance, Becton Dickinson and Co. Made in the United Kingdom) containing a clot activator. Blood samples were centrifuged for 15 minutes at 1500 x g within 1 hour of collection. Hemolytic, lipemic, and icteric serum samples and samples with insufficient volume were excluded from the study. Accepted samples were divided into two separate aliquots, and serum procalcitonin assay was run simultaneously on Siemens Advia Centaur® XP and Getein 1600 analyzers.
Until recently, the only available method to measure procalcitonin was the BRAHMS procalcitonin Kryptor method. However, BRAHMS procalcitonin is considered the reference method for accurate and reliable technology. In addition, many global companies partnering with BRAHMS are also certified for the use of procalcitonin and antibodies [7].
The ADVIA Centaur® BRAHMS procalcitonin assay is a one-pass, 20-minute antibody sandwich immunoassay in which the Solid Phase contains monoclonal antibodies to fluorescein covalently linked to paramagnetic particles. Getein Procalcitonin Fast Test Kit is an immunofluorescence (Lateral Flow Chromatography) method.
Analytical performance of the Advia Centaur® BRAHMS procalcitonin method
The Advia Centaur® BRAHMS procalcitonin test is performed using the Siemens Advia Centaur® XP analyzer routinely used in the laboratory. The measurement range declared by the manufacturer is 0.02-75 ng/mL. Total % CV: 6.7.
Analytical performance of Getein 1600 serum procalcitonin Fast Test kit
As explained in the “Comparisons Within a Measurement Procedure” section in the EP 9A3 guide, accuracy and imprecision studies were carried out to evaluate the analytical performance since the measurement method to be compared is a previously evaluated and verified method [5].
Two different levels of serum pools (Low and High) were prepared for the linearity study, and their concentrations were measured as 1.97 ng/ml and 48.6 ng/ml on Siemens ADVIA Centaur® analyzer using ADVIA Centaur® BRAHMS procalcitonin assay kit. The low serum pool was diluted with the diluent provided by the manufacturer to final concentrations of 0.98, 0.49, 0.25, 0.125, 0.0625 ng/ml. The high serum pool was diluted to final concentrations of 24.3, 12.15, 6.075, 3.037, 1.52 ng/ml. Each dilution sample was run in duplicate, and the arithmetic mean of the results was calculated. In addition, obtained data were evaluated with Passing-Bablok Regression analysis [5].
The recovery study is performed to estimate proportional systematic error. The recovery study is based on guide EP15-A2.
Accordingly, 0.5 ml of the standard solution (ADVIA Centaur® BRAHMS procalcitonin Calibrator solution of 26 ng/ml concentration) and 7 ml patient sample containing 0.5 ng/ml procalcitonin were mixed. The obtained sample was run 10 times in succession in the Getein 1600 procalcitonin system. The average of the recovery percentage (Rmavg) was calculated with the formula “[(Observed Concentration - Sample Concentration)/Added Concentration x 100] / Number of run”.
The repeatability study includes calculating the within-run precision. To this end, internal quality control samples (Level-1 and Level-2) were run 3 times a day in the Getein 1600 device for 5 days. The %coefficient of variation (%CV) values for Level-1 and Level-2 were calculated and compared with the values reported by the manufacturer [6]. Serum procalcitonin results from 60 patient samples studied simultaneously on both instruments were used for the comparison study.
Statistical analysis
Regression analysis and Cusum test were performed for the statistical analysis of the linearity study of the Getein procalcitonin Fast Test Kit procalcitonin assay. The repeatability was assessed by calculating the internal quality control results’ CV. Procalcitonin results obtained with the ADVIA Centaur® BRAHMS procalcitonin kit were accepted as a reference for the method comparison study. Passing-Bablok regression analysis was used to evaluate constant and proportional biases between methods. In addition, the Cusum test was conducted to evaluate linearity. For significant agreement between assay methods, the intersection’s 95% confidence interval (CI) should contain the value of 0, and the 95% CI of the slope should contain 1 [8]. The Bland-Altman plot was used to visualize the distribution of the difference between the results obtained by the two methods. The arithmetic average of procalcitonin measurements performed with two methods is located on the X-axis. The percentage difference between the two methods was placed on the Y-axis in line with recommendations in the CLSI guidelines. The inter-method agreement was assessed using Cohen’s kappa (κ) analysis at 0.5 ng/ml and 2.0 ng/ml cut-off levels; values higher than 0.5 ng/ml indicate bacterial infection; and higher than 2 ng/ml indicate systemic infection and severe sepsis [1]. A kappa value of 1.0 indicates perfect agreement, > 0.90 almost perfect agreement; 0.80-0.90 indicates strong agreement, 0.60-0.79 moderate agreement, 0.40-0.59 weak agreement, 0.21-0.39 minimum agreement, and <0.20 indicates no agreement between the methods. For all statistical analyses, a p-value < 0.05 was considered significant. Statistical analysis of the data was performed in MedCalc 15.0 (MedCalc Software, Ostend, Belgium).
Results
Serial dilutions were prepared from serum pools with concentrations of 1.97 ng/ml and 48.6 ng/ml, respectively (Table 1). Regression equation is "y= -0.03 (-0.07 to 0.05) + 1.01 (0.7 to 1.08) x" for the low level dilutions. The constant error was calculated as -0.03 (expected 0), the proportional error 1.01 (expected ±1). At high levels, the regression equation is "y= 0.463 (-1.16 to 2.01) + 0.912 (0.72 to 1.04) x"; the constant error is 0.463 and the proportional error is 0.912. Cusum test shows no deviation from linearity in measurements made with both dilution series. (Fig. 1). As a result of the repeatability study performed with internal quality control solutions, the CV% was calculated as 3.75% for Level-1 and 4.2% for Level-2 (Table 2).
The expected procalcitonin value in the recovery study was determined as 2.2 ng/mL. The sequential measurement results ranged from 1.86 ng/mL (Rm: 75.56%) to 2.15 ng/mL (Rm: 91.67%). The Average recovery percentage (Rmavg) was calculated as 86% (Table 3).
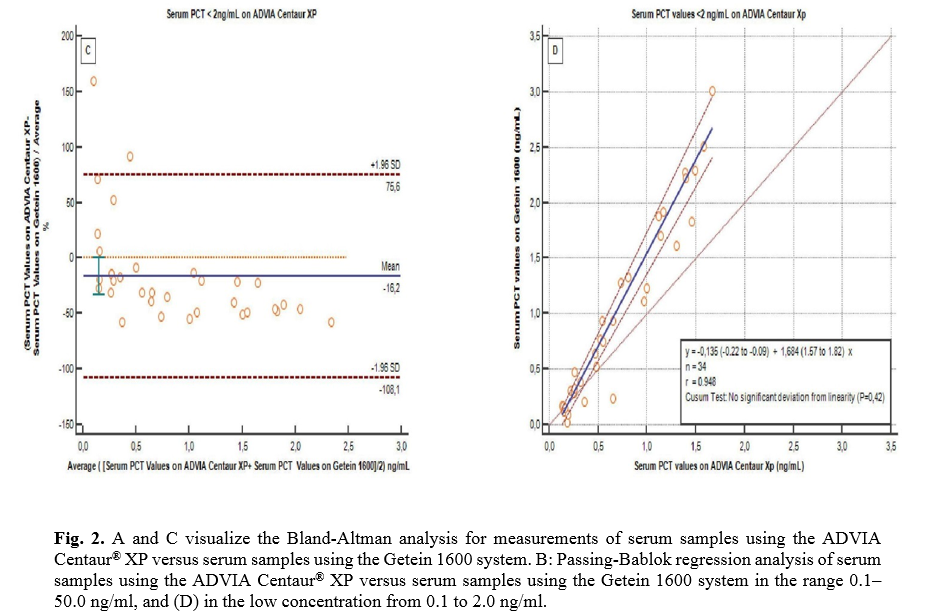
Bland-Altman plots and Passing-Bablok regression analysis were used to compare patient results (Fig. 2). The concordance between the two methods was analyzed at the range of 0.1-50 ng/ml, which is the measurement range of the Getein 1600 system. In addition, low procalcitonin values between 0.1-2 ng/ml were also assessed since this system is considered a screening tool using a cut-off value of 0.5 ng/ml. The “difference value” in the range of 0.1-50 ng/ml is -12.5%. The regression equation was calculated as "y=0.04(-0.03 to 0.19) + 1.18(1.09 to 1.28)x". The correlation coefficient is r=0.986. Deviation from linearity was determined by the Cusum test (p=0.01). The "difference value" in the range of 0.1-2 ng/ml is -16.2%. The regression equation was calculated as "y=-0.13(-0.22 to -0.09) + 1.68(1.57 to 1.82)x". The correlation coefficient is r=0.948. No deviation from linearity was detected with the Cusum test (p=0.42). Fifteen of the patients analyzed with the ADVIA Centaur® XP system measured below 0.5 ng/ml, compared to 14 in the Getein 1600 system (Table 4). With the ADVIA Centaur® XP, 19 results are measured in the range of 0.5-2 ng/ml, and 26 results were >2.0 ng/ml, while with the Getein 1600 system, these numbers are 16 and 30, respectively. The inter-rater agreement between the patient results of both devices was evaluated by the Kappa test at cut-off levels of “0.5 ng/ml and 2 ng/ml”. Kappa values calculated as 0.864 and 0.800 (p<0.001), respectively, indicate a strong agreement between the methods (Table 4).
Table 1: Dilution levels and final concentrations prepared from the low and high serum pools for linearity study
|
Low Concentration Dilutions
|
High Concentration Dilutions
|
|
Dilution level
|
Expected PCT values (ng/ml)
|
Getein 1600 PCT fast test result (ng/ml)
|
Dilution level
|
Expected PCT values (ng/ml)
|
Getein 1600 PCT fast test result (ng/ml)
|
| L1 |
1.97 |
1.98 |
L7 |
48.6 |
44.8 |
| L2 |
0.98 |
0.95 |
L8 |
24.3 |
22.9 |
| L3 |
0.49 |
0.38 |
L9 |
12.15 |
11.5 |
| L4 |
0.25 |
0.22 |
L10 |
6.075 |
5.17 |
| L5 |
0.125 |
0.09 |
L11 |
3.037 |
3.6 |
| L6 |
0.0625 |
0.05 |
L12 |
1.52 |
1.85 |
PCT= Procalcitonin
Table 2. Results of repeatability study
|
Internal quality control level
|
Mean (ng/ml)
|
SD (ng/ml)
|
%CV
|
Manufacturer’s %CV data
|
| Level-1 |
0.802 |
0.03 |
3.75 |
<%10 |
| Level-2 |
9.76 |
0.41 |
4.2 |
<%10 |
Table 3. Results of recovery study
|
Sample concentration
(ng/ml)
|
Added concentration
(ng/ml)
|
Observed concentration
(ng/ml)
|
Rm(%)*
|
| 0.5 |
1.8 |
2.01 |
83.89 |
| 2.08 |
87.78 |
| 1.86 |
75.56 |
| 2.15 |
91.67 |
| 1.98 |
82.22 |
| 2.03 |
85.00 |
| 2.14 |
91.11 |
| 2.02 |
84.44 |
| 2.08 |
87.78 |
| 2.11 |
89.44 |
|
|
Rmavg(%)** |
86 |
*Rm(%)(Recovery Percentage) = (Observed C. – Sample C.)/ Added C. X 100, **Rm(%)avg: Average Rm(%)
Table 4. Classification of procalcitonin status and inter-rater agreement between ADVIA Centaur® XP and GETEIN 1600 methods according to cut-off values determined
|
N=60
|
Procalcitonin results distribution
|
|
<0.5 ng/ml |
0.5-2.0 ng/ml |
>2.0 ng/ml |
| ADVIA Centaur® XP procalcitonin |
15 (25%) |
19 (31.6%) |
26 (43.4%) |
| Getein 1600 |
14 (23.3%) |
16 (26.7%) |
30 (50%) |
|
|
Cut-off value (ng/ml)
|
Measure of agreement
κ (Kappa value)
|
Agreement
(%)
|
p
|
| 0.5 |
0.864 |
95 |
<0.001 |
| 2 |
0.800 |
90 |
<0.001 |
Discussion
In this study, we examined the analytical performance and usability of Getein 1600 analyzer for procalcitonin assay. While the analytical performance of the Getein 1600 procalcitonin assay is acceptable at levels less than 2 ng/ml, it appears that the agreement with the ADVIA Centaur® XP procalcitonin results deteriorates as the procalcitonin level rises. Constant error is 0.463 in linearity study with high procalcitonin concentrations. The CV% values obtained in the repeatability study are 3.75% for Level-1 and 4.2% for Level-2. The CV% values are close to the values found by Dupuy et al. (3.9%) in their study with several point of care testing procalcitonin systems [7]. Jaffe et al. suggested that CV values of up to 20% can be accepted in point of care systems [9]. Accordingly, repeatability is acceptable for the Getein 1600 procalcitonin test. However, the Rmavg value (86%) for the Getein 1600 procalcitonin test is far from the expected range. This indicates that there is a constant systematic error. Performing the recovery study at lower and higher levels may provide a more precise assessment of proportional error. The comparison study shows that as the procalcitonin level increases, the compatibility between the two systems deteriorates. Notably, the constant error is 1.18 in the range of 0.1-50 ng/ml. In the Inter-rater agreement analysis, the kappa value is 0.86 for cut-off 0.5 ng/ml and 0.80 for cut-off 2.0 ng/ml. These data indicate that the Getein 1600 procalcitonin assay’s compatibility with the ADVIA Centaur XP procalcitonin tends to deteriorate at high levels.
Limitations
The ADVIA Centaur® XP procalcitonin system was used as a reference to evaluate the analytical performance of the Getein 1600 procalcitonin assay. Although BRAHMS is certified and accepted as the gold standard, this method also has constant and proportional error values. These have been neglected in this study. The matrix effect of the serum pools used in the linearity study and other analytes that may cause interference were neglected. Sixty serum samples were used for the comparison study. Higher sample numbers may allow statistical analysis to yield more precise results.
Conclusion
The Getein 1600 procalcitonin test should be used for triage or screening purposes in emergency departments and out-patient clinics. However, a high constant error and deviation from linearity detected at high concentrations indicate that this test should not be used to initiate an antibiotic therapy or alter the current therapy course and monitoring. Furthermore, given the limitations of this study, the analytical performance of the Getein 1600 procalcitonin assay needs to be evaluated in different patient groups and a wider population.
Conflict of Interest
The authors declare no conflict of interest.
Acknowledgment
Not applicable.
References
- Meisner M. Procalcitonin-Biochemistry and Clinical Diagnosis. 1st ed, Bremen: UNI MED; 2010.
- Gendrel D, Bohuon C. Procalcitonin as a marker of bacterial infection. Pediatr Infect Dic J. 2000; 19(8): 679-88.
- Schuetz P, Bretscher C, Bernasconi L, Mueller B. Overview of procalcitonin assays and procalcitonin-guided protocols for the management of patients with infections and sepsis. Expert Rev Mol Diagn. 2017; 17(6): 593-601.
- Van Rossum AM, Wulkan RW, Oudesluys-Murphy AM. Procalcitonin as an early marker of infection in neonates and children. Lancet Infect Dis. 2004; 4(10): 620-23
- CLSI. Measurement procedure comparison and bias estimation using patient samples; Approved Guideline, 3rd ed, CLSI Document EP09-A3. Wayne PA: Clinical and Laboratory Standards Institute; 2013.
- CLSI. User Verification of Precision and Estimation of Bias; Approved guideline, 3rd ed, CLSI Document EP15-A3. Wayne PA: Clinical and Laboratory Standards Institute; 2014.
- Dupuy AM, Chevrier Q, Olejnik Y, Bargnoux AS, Badiou S, Cristol JP. Analytical evaluation of point-of-care procalcitonin (PCT) and clinical performances in an unselected population as compared with central lab PCT assay. Clin Chem Lab Med. 2017; 55(8): 167-71.
- Bilic-Zulle L. Comparison of methods: Passing and Bablok regression. Biochem Med (Zagreb) 2011; 21(1): 49-52.
- Jaffe AS, Apple FS, Morrow DA, Lindahl B, Katus HA. Being rational about (Im)precision: a statement from the biochemistry subcommittee of the joint european society of cardiology/American college of cardiology foundation/American heart association/world heart federation task force for the definition of myocardial infarction. Clin Chem. 2010; 56(6): 941-43.