Jaafari M, Hadinedoushan H, Akhavan Tafti M. Correlation of Tissue Distribution of HLA-G and HLA-E and Degree of Tumor Malignancy in Patients with Breast Cancer. IJML 2022; 9 (4) :311-318
URL:
http://ijml.ssu.ac.ir/article-1-457-en.html
Reproductive Immunology Research Center, Shahid Sadoughi University of Medical Science, Yazd, Iran
Full-Text [PDF 291 kb]
(151 Downloads)
|
Abstract (HTML) (292 Views)
Full-Text: (127 Views)
Breast cancer is the second cause of cancer death in women worldwide. It is the most common multi-factorial neoplasm with an unclear etiology [1]. The incidence of breast cancer is rising in women around the world [2]. The incidence rate of breast cancer in developed countries is higher than in developing countries, but in recent years the number of breast cancer cases has been growing in developing countries such as Iran [3]. It is estimated that more than one million women are diagnosed with breast cancer yearly, and more than 410,000 women will die from the disease, so almost 14% of female cancer deaths are due to breast cancer [4]. Current evidence suggests that the tumor microenvironment has used different mechanisms to evade the host immune system [5]. Alteration in the expression of human leukocyte antigen (HLA) class I molecules plays the main role in regulating immune responses. Its essential role in impairing the HLA molecules is through interaction with T, and natural killer (NK) cells specific receptors [6]. Down-regulation of HLA expression can help the tumor to escape from immune surveillance and represents a potential mechanism for breast carcinogenesis and metastasis. These processes limit the ability of cytotoxic T-cells to eliminate these cells and reduce the clinical efficacy of T-cell-based cancer therapy [7]. Thus, the presence of these antigens may lead to a more immunogenic tumor and causes a favorable prognosis [8]. HLA-G and HLA-E as immune-regulatory molecules pertain to the HLA-Ib family [9]. Under normal condition, HLA-E molecules are expressed in most tissues, and expression of HLA-G molecules are strictly limited to specific tissues [10]. Co-expression of HLA-G and HLA-E is seen in diverse cell populations, which can modulate the immune response [8]. Given that the overexpression of HLA-G and HLA-E may be a prominent finding in breast cancer and plays an important role in diagnosis, prognosis and treatment, and no comprehensive study has been conducted in this regard in our region, the aim of this study is to investigate the distribution of HLA-E and HLA-G expression in breast cancer and its relationship with degree of malignancy.
Materials and Methods
Sample selection
This cross-sectional study was conducted on145 patients with ductal breast carcinoma (56 patients with grade 3, 56 with grade 2, and 33 with grade 1) in Shahid Sadoughi hospital, Yazd, Iran. The age range of patients was 30 to 60 years. This study was approved by the Ethical Committee of Shahid Sadoughi University of Medical Science, Yazd, Iran.
Histopathological analysis
Tumor tissues of breast cancer were taken from the pathology department of Shahid Sadoughi Hospital. The tissues were fixed in 10% neutral buffer formalin and then put in different concentrations of alcohol (70%, 80%, 90%, and 100%), xylene, and paraffin in an automatic tissue processor. Then specimens were sliced to 2 μm. Then hematoxylin and eosin (H & E) were utilized as a histological method for staining and analyzing tissue sections. Bloom and Richardson modified detected the histological tumor grade by Elson [11].
Immunohistochemistry method
The immunohistochemical method was performed on specimens that were embedded in wax paraffin. In summary, 2 μm thick sections were mounted, dewaxed by xylene, and then rehydrated through decreasing alcohol density. After blocking endogenous peroxidase activity by peroxide hydrogen, slides were transferred to citrate buffer and boiled for 15 minutes. Then, sections were washed with tris buffer saline (TBS), and primary antibodies, including anti-HLA-E antibody [MEM-E/02], and anti-HLA-G antibody [4H84] (Abcam company, USA), were used. Incubation time was done according to the instruction of the kit. Following washing with TBS, a secondary antibody, Lambda Mouse-Rabbit antibody (DAKO Company, Denmark), was used. Then, slides were placed in 3, 3-diamino-benzidine tetra-hydrochloride (Sigma), and the slides were stained with hematoxylin (20- 30 seconds) and tap water, followed by immersing in graded alcohol, xylene and finally mounted.
Scoring
The tumor staining was scored as follows. Distribution, less than 5% of HLA antigens in samples, were considered negative, less than 25% was considered +1, distribution between 25-50% was considered +2, and more than 50% was considered +3.
Statistical analysis
Statistical analysis was performed using SPSS version 19. Data were analyzed using the Chi-Square test. The relation between the expression of these biomarkers and the degree of malignancy was done by the Pearson Chi-Square test. Statistically, p<0.05 was considered significant.
Results
Results of staining of HLA-G and HLA-E distribution on the surface of tumor cells and tumor-infiltrating lymphocyte are presented in Figure 1.
Tissue distribution of HLA-G
The distribution of HLA-G expression in breast cancer cells according to grade is shown in Table 1. As shown in table 1, among 145 patients, 79.3% of tumors didn’t express HLA-G at all, 17.9% expressed +1 positive, 2.8% expressed +2 positive, and no patients expressed +3 positive. Tissue distribution of HLA-G was seen in 20.7% of patients. Moreover, there was a significant difference between the two groups (groups 1 and 3 (p=0.001) and group 2 and group 3 (p=0.001) in terms of the frequency distribution of HLA-G. Furthermore, there was a significant correlation between the grade of disease and HLA-G expression (p = 0.001).
Tissue distribution of HLA-E
The distribution of HLA-E expression in breast cancer cells in terms of grade is shown in Table 2. Among 145 patients, 51% of tumors did not express HLA-E at all, 36.6 % of them expressed +1 positive, 8.3% expressed +2 positive, and 4.1% expressed +3 positive. Moreover, 44.6% of patients with grade 3 expressed +1 positive, and 12.5% with grade II expressed +2 positive. The highest distribution of tissue expression +3 positive was observed in patients with grade 2 (7.1%). Expression of HLA-E was seen in 49% of patients.
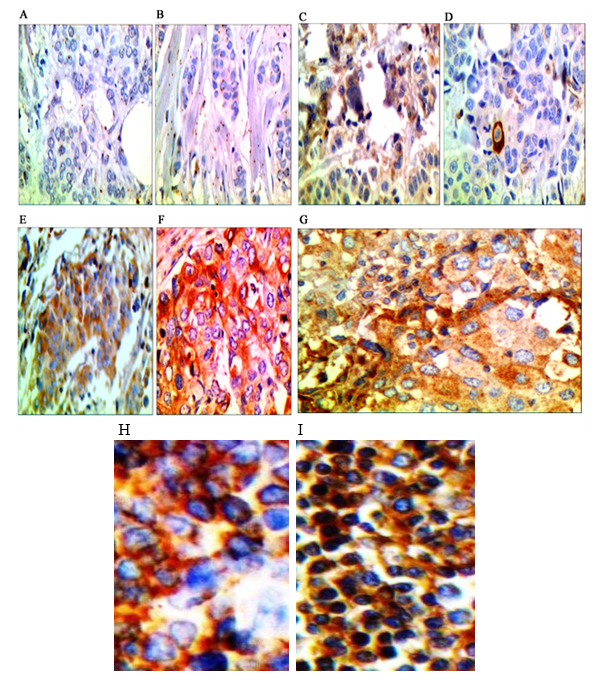
Fig. 1. Staining breast cancer sections with immunohistochemistry from less than 5% of HLA distribution (-) to more than 50% (+3). A. Staining of the section with monoclonal anti-HLA-G, less than 5% of HLA distribution (-).B. Staining of the section with monoclonal anti-HLA-E less than 5% of HLA distribution (-), C. Staining of the section with monoclonal anti-HLA-G less than 25% of HLA distribution (+1). D. Staining of the section with monoclonal anti-HLA-E less than 25% of HLA distribution (+1). E. Staining of the section with monoclonal anti-HLA-G between 25-50% of HLA distribution (+2). F. Staining of the section with monoclonal anti-HLA-E between 25-50% of HLA distribution (+2). G. Staining of the section with monoclonal anti-HLA more than 50% of HLA distribution (+3). The absence of brown color indicates negative expression of these molecules in the tissue samples. H. Control positive of HLA-G. I. control positive of HLA-E.
Table1. Distribution of HLA-G on the surface of tumor cells in breast cancer tissue according to grade
HLA-G
Grade |
Negative(-) |
Positive(+)
Group 1 |
Positive(++)
Group 2 |
Positive(+++)
Group 3 |
Total |
| 1 |
29 (87.9%) |
4(12.1%) |
0 (0%) |
- |
33 (100%) |
| 2 |
52 (92.9%) |
4 (7.1%) |
0 (0%) |
- |
56 (100%) |
| 3 |
34 (60.7%) |
18 (32.2%) |
4 (7.1%) |
- |
56 (100%) |
| Total |
115 (79.3%) |
26 (17.9%) |
4 (2.8%) |
- |
145 (100%) |
Table2. Distribution of HLA-E on the surface of tumor cells in breast cancer tissue in terms of grade
HLA-E
Grade |
Negative(-) |
Positive(+) |
Positive(++) |
Positive(+++) |
Total |
| 1 |
25 (75.8%) |
8 (24.2%) |
0 (0%) |
0 (0%) |
33 (100%) |
| 2 |
25 (44.6%) |
20 (35.8%) |
7 (12.5%) |
4 (7.1%) |
56 (100%) |
| 3 |
24 (42.9%) |
25 (44.6%) |
5 (8.9%) |
2 (3.6%) |
56 (100%) |
| Total |
74 (51.0%) |
53 (36.6%) |
12 (8.3%) |
6 (4.1%) |
145 (100%) |
Table 3. Simultaneously expression of HLA-E and HLA-G in tissue samples
| P-value |
+1 |
HLA-G
HLA-E |
| 0.013 |
14 (82.4%) |
+1 |
| 3 (17.6%) |
+2 |
| 17 (100%) |
Total |
P<0.05 is significant.
Moreover, there was a significant difference between the two groups (groups 1 and 3 (p=0.01) and group 2 and group 3 (p=0.01) regarding the frequency distribution of HLA-E. Furthermore, there was a significant correlation between the grade of disease and HLA-G expression (p=0.01). In addition, a significant correlation was seen between the grade of disease and frequency distribution of HLA-E (p=0.03). Simultaneously expression of HLA-E and HLA-G in tissue samples is shown in Table 3. A significant difference was seen between the simultaneous expression of HLA-E (+1 and +2 positive) and HLA-G (+1 positive) in tissue samples (p=0.01). Moreover, a statistically significant correlation was seen between the simultaneous expression of HLA-G and HLA-E with grade (p=0.03, r=0.176).
Discussion
Change of HLA expression was frequent during tumor progression and development of tumor HLA-G and E were “non-classical” HLA antigens with immunosuppressive effects [12]. There were few controversial studies regarding the protein expression of HLA isoforms in cancer. HLA-G expression was seen in various cancers, such as breast cancer, cervical cancer, endometrial cancer, colorectal cancer, squamous cell carcinoma, ovarian cancer, and thyroid cancer [13]. In the current study, the expression of HLA-G was seen in breast cancer patients at 20.7% (+1 positive, +2 positive). Generally, there was a significant correlation between HLA-G distributions and a degree of malignancy. This finding indicated that expression of the HLA-G biomarker might contribute to the prognosis and progression of breast cancer. da Silva et al. assessed the expression of HLA molecules in breast cancer and observed that among 52 invasive ductal carcinomas, 31 cases (59.6%) exhibited high expression of HLA-G. They also reported that up-regulation of HLA-G was associated with immune response evasion and breast cancer aggressiveness [4].
HE et al. demonstrated the distribution of tissue expression of the HLA-G molecule in 66% of patients with breast cancer. Moreover, this expression was associated with tumor size, nodules, and the clinical stage of cancer [14]. Based on these studies, the distribution of HLA-G biomarkers was different in these studies. It seems that the score of staining, subtypes of breast cancer, race, stage, and grade of the disease may be the reason for this difference.
Ming Shih et al. assessed HLA-G expression in cancer diagnosis and reported that HLA-G was not expressed in normal breast tissues but in breast cancer tissues. Moreover, disease progression increased these biomarkers’ expression [13]. Urosevic et al. showed that over-expression of HLA-G in breast cancer tissue could help to spread malignant cells. Moreover, the interstitial distribution of these molecules in breast cancer patients was more in the advanced stages of the disease. Therefore, determining the tissue distribution of these molecules could help to determine the prognosis and predict the clinical progression of disease in patients [15]. Researchers assessed the predictive value of expression of HLA class I tumor and reported that it was considered a predictive factor for chemotherapy response. Moreover, they observed a significant association between the over-expression of the HLA-G biomarker and the grade of disease in agreement with our study [16]. A study evaluated the expression of HLA molecule in breast cancer and reported the association between HLA-G with tumor aggressiveness [4], which was consistent with our study. Chen et al. reported that HLA-G can play the main role in breast cancer progression and may be a useful preoperative biomarker for diagnosis [17]. Another study reported that HLA-G could be used as a potential chemotherapy marker and diagnostic marker for advanced stages of cancer [18].
Transcriptional and post-transcriptional modifications and epigenetic modifications regulated HLA-G expression [19, 20].
Furthermore, microenvironmental factors, including cytokine profiles and therapeutics, increased HLA-G expression. Given the immune suppressive functions of HLA-G expression in favoring tumor progression and immune evasion, HLA-G induction within immune therapy may impair the therapeutic effects [13]. Mirjani et al. demonstrated that tumor cells exposed to hypoxia undergo epigenetic changes, including histone acetylation and DNA demethylation, leading to HLA-G transcriptional activation. Additional inflammatory stimuli via nuclear factor kappa B could enhance HLA-G transcript/protein levels in tumor cells, protecting the host immune system [21].
In our study, the expression of HLA-E was seen in 49% of breast cancer patients. Generally, there was a significant correlation between distributions of HLA-E and the degree of malignancy. Less information was available about HLA-E expression in malignant cells, in contrast to HLA-G [22]. Guo et al. assessed the prognosis of colorectal cancer through HLA-G and HLA-E in colorectal cancer and demonstrated HLA-E expression in 65.7% of patients with colorectal cancer. Moreover, HLA-E expression was significantly correlated to tumor metastasis [23].
Regarding hematopoietic malignancies, expression of surface HLA-E was found in a high percentage of lymphoid tumor cells [24]. Levy et al. evaluated HLA-E protein in primary colorectal cancer and reported that HLA-E was over-expressed in colorectal cancer [25]. Moreover, the expression of HLA-E was the main factor for the outcome prediction of patients with breast cancer [26]. Another study showed that HLA-E expression positively correlated with tumor progression, prognosis, and worse outcome in the lung, colorectal, breast cancer, and glioblastoma [27]. In addition, another study assessed HLA-E expression in human renal cell carcinoma and reported that HLA-E was frequently overexpressed in renal cell carcinoma and associated with reduced immunogenicity [28].
In contrast, there were controversial studies considering the effect of HLA-E expression on the survival of cancer patients. Spaans et al. demonstrated a positive correlation between HLA-E and better outcomes in cervical cancer [29]. Therefore, more studies should be conducted in this regard. Several studies also showed that a single immune marker was insufficient to select patients with high risk and a combination of HLA-G and HLA-E may lead to better prognostic value than a single immune marker [30, 31]. Zeestraten et al. also reported that combined expression of HLA class I, HLA-E, and HLA-G predicted the prognosis of patients with colon cancer [32]. Marın et al. reported that HLA-E was normally expressed in various tissues; however, it was expressed weakly on the surface of the cells, but its stability depended on the co-expression of HLA-A, HLA-G, and HLA-E molecules [33].
Conclusion
A significant relation was seen between the distribution of HLA-G and HLA-E expression and the degree of malignancy. Therefore, these biomarkers’ expression may contribute to the prognosis and progression of breast cancer.
Conflict of Interest
The authors declare that they have no competing interests.
Acknowledgments
We would like to thank the staff in the pathology department of Shahid Sadoughi Hospital for their kind cooperation in this study.
References
- Sheikhpour R, Agha Sarram M, Zare Mirakabad MR, Sheikhpour R. Breast cancer detection using two-step reduction of features extracted from fine needle aspirate and data mining algorithms. Iranian Quarterly Journal of Breast Disease 2015;7(4): 43-51.
- Coughlin SS, Ekwueme DU. Breast cancer as a global health concern. Cancer Epidemiology 2009; 33(5): 315-18.
- Rezaianzadeh A, Heydari ST, Hosseini H, Haghdoost AA, Barooti E, Lankarani KB. Prevalence of breast cancer in a defined population of iran. Iran Red Crescent Med J. 2011; 13(9): 647-50.
- da Silva GB, Silva TG, Duarte RA, Neto NL, Carrara HH, Donadi EA, et al. Expression of the classical and nonclassical HLA molecules in breast cancer. International journal of breast cancer. 2013; 250435.
- Gonçalves AS, Oliveira JP, Oliveira CF, Silva TA, Mendonça EF, Wastowski IJ, et al. Relevance of HLA-G, HLA-E and IL-10 expression in lip carcinogenesis. Hum Immunol. 2016; 77(9): 785-90.
- Palmisano GL, Fardin P, Capanni P, Nicolò G, Salvi S, Spina B, et al. Analysis of HLA-G expression in breast cancer tissues. Hum Immunol. 2002; 63(11): 969-76.
- Bubeník J. MHC class I down-regulation: tumour escape from immune surveillance?. Int J Oncol. 2004; 25(2): 487-91.
- Redondo M, Garcı́a J, Villar E, Rodrigo I, Perea-Milla E, Serrano A, et al. Major histocompatibility complex status in breast carcinogenesis and relationship to apoptosis. Hum Pathol. 2003; 34(12): 1283-289.
- Morandi F, Pistoia V. Interactions between HLA-G and HLA-E in physiological and pathological conditions. Frontiers In Immunol. 2014; 5(1): 394.
- Kovats S, Main EK, Librach C, Stubblebine M, Fisher SJ, DeMars R. A class I antigen, HLA-G, expressed in human trophoblasts. Science 1990; 248(4952): 220.
- Elston CW. Grading of invasive carcinoma of the breast. In: Page DL, A.T., editors., Diagnostic histopathology of the breast. Edinburgh: Churchill Livingstone, 1988.
- Wuerfel F, Huebner H, Häberle L, Gass P, Hein A. HLA‑G and HL‑F protein isoform expression in breast cancer patients receiving neoadjuvant treatment. Scientific Report 2020; 10: 1570-577.
- Shih IEM. Application of HLA-G expression in the diagnosis of human cancer. Hum Immunol. 2007; 68(4): 272-76.
- He X, Dong DD, Yie SM, Yang H, Cao M, Ye SR, et al. HLA-G expression in human breast cancer: implications for diagnosis and prognosis, and effect on allocytotoxic lymphocyte response after hormone treatment in vitro. Ann Surgic Oncol. 2010;17(5): 1459-469.
- Urosevic M, Dummer R. Human leukocyte antigen-G and cancer immunoediting. Cancer Res. 2008; 68(3): 627-30.
- de Kruijf EM, van Nes JG, Sajet A, Tummers QR, Putter H, Osanto S, et al. The predictive value of HLA class I tumor cell expression and presence of intratumoral Tregs for chemotherapy in patients with early breast cancer. Clinic Cancer Res. 2010; 16(4): 1272-280.
- Chen HX, Lin A, Shen CJ, Zhen R, Chen BG, Zhang X, et al. Upregulation of human leukocyte antigen–G expression and its clinical significance in ductal breast cancer. Hum Immonol. 2010; 71(9): 892-98.
- Komohara Y, Harada M, Ishihara Y, Suekane S, Noguchi M, Yamada A, et al. HLA-G as a target molecule in specific immunotherapy against renal cell carcinoma. Oncol Rep. 2007; 18(6): 1463-468.
- Castelli EC, Veiga-Castelli LC, Yaghi L, Moreau P, Donadi EA. Transcriptional and post-transcriptional regulations of the HLA-G gene. J Immunol Res. 2014; 734068: 1-15.
- Seliger B. Role of microRNAs on HLA-G expression in human tumors. Hum Immunol. 2016; 77(9): 760-63.
- Mirjani U, Reinhard D. Human leukocyte antigen–G and cancer immunoediting. Cancer Res. 2008; 68: (3): 1-9.
- Campoli M, Ferrone S. HLA antigen changes in malignant cells: epigenetic mechanisms and biologic significance. Oncogene 2008; 27(45): 5869-885.
- Guo ZY, Lv YG, Wang L, Shi SJ, Yang F, Zheng GX, et al. Predictive value of HLA-G and HLA-E in the prognosis of colorectal cancer patients. Cell Immunol. 2015; 293(1): 10-16.
- Lo Monaco E, Tremante E, Cerboni C, Melucci E, Sibilio L, Zingoni A, et al. Human leukocyte antigen E contributes to protect tumor cells from lysis by natural killer cells. Neoplasia 2011; 13(3): 822-30.
- Levy EM, Bianchini M, Von Euw EM, Barrio MM, Bravo AI, Furman D, et al. Human leukocyte antigen-E protein is overexpressed in primary human colorectal cancer. Int J Oncol. 2008; 32(3): 633-41.
- de Kruijf EM, Sajet A, van Nes JG, Natanov R, Putter H, Smit VT, et al. HLA-E and HLA-G expression in classical HLA class I-negative tumors is of prognostic value for clinical outcome of early breast cancer patients. J Immunol. 2010; 185(12): 7452-459.
- Rodríguez JA. HLA‑mediated tumor escape mechanisms that may impair immunotherapy clinical outcomes via T‑cell activation. Oncology Letters 2017;14(4): 4415-427.
- Seliger B, Jasinski-Bergner S, Quandt D, Stoehr C, Bukur J, Wach S, et al. HLA-E expression and its clinical relevance in human renal cell carcinoma. Oncotarget 2016; 7(41): 67360-7372.
- Spaans VM, Peters AA, Fleuren GJ, Jordanova ES. HLA-E expression in cervical adenocarcinomas: association with improved long-term survival. J Transl Med. 2012; 10:184.
- Menon AG, Morreau H, Tollenaar RA, Alphenaar E, Van Puijenbroek M, Putter H, et al. Down-regulation of HLA-A expression correlates with a better prognosis in colorectal cancer patients. Lab Invest. 2002; 82: 1725-733.
- Watson NF, Ramage JM, Madjd Z, Spendlove I, Ellis IO, Scholefield JH, et al. Immuno-surveillance is active in colorectal cancer as downregulation but not complete loss of MHC class I expression correlates with a poor prognosis. Int J Cancer. 2006; 118: 6-10.
- Zeestraten EC, Reimers MS, Saadatmand S, Dekker JT, Liefers GJ, Van Den Elsen PJ, et al. Combined analysis of HLA class I, HLA-E and HLA-G predicts prognosis in colon cancer patients. British J cancer 2014; 110(2): 459-68.
- Marın R, Ruiz-Cabello F, Pedrinaci S. Analysis of HLA-E expression in human tumors. Immunogenetics 2003; 54(11): 767-75.
Type of Study:
Research |
Subject:
Immunology Received: 2022/08/1 | Accepted: 2022/09/4 | Published: 2022/12/31