
International Journal of Medical Laboratory
Shahid Sadoughi University of Medical Sciences
Thu, Jun 25, 2026
[Archive]

Volume 11, Issue 4 (November 2024)
IJML 2024, 11(4): 292-303 |
Back to browse issues page


Download citation:
BibTeX | RIS | EndNote | Medlars | ProCite | Reference Manager | RefWorks
Send citation to:


BibTeX | RIS | EndNote | Medlars | ProCite | Reference Manager | RefWorks
Send citation to:
Heidari F, Alavi Bajegani A S, Ayatollahi J, Mousavi Anari S A, Sharif Yazdi M, Akhondi Z. Epidemiological and Laboratory Investigation of Influenza in Hospitalized Patients at Yazd with Emphasis on Improving Influenza Registry Deficiencies. IJML 2024; 11 (4) :292-303
URL: http://ijml.ssu.ac.ir/article-1-547-en.html
URL: http://ijml.ssu.ac.ir/article-1-547-en.html
Faezeh Heidari 
 , Akram Sadat Alavi Bajegani * , Jamshid Ayatollahi , Seyed Alireza Mousavi Anari , Mohammad Sharif Yazdi , Zohre Akhondi
, Akram Sadat Alavi Bajegani * , Jamshid Ayatollahi , Seyed Alireza Mousavi Anari , Mohammad Sharif Yazdi , Zohre Akhondi
Department of Infectious Diseases, Shahid Sadoughi Hospital, School of Medicine, Shahid Sadoughi University of Medical Sciences, Yazd, Iran
Full-Text [PDF 319 kb]
(238 Downloads)
| Abstract (HTML) (495 Views)
References
Full-Text: (109 Views)
Introduction
Influenza, or the flu, is an acute respiratory infection caused by RNA viruses from the Orthomyxoviridae family, primarily affecting the lungs of both humans and animals [1-3]. The disease is characterized by the sudden onset of fever, headache, muscle pain, weakness, and lethargy [4], and it can occur sporadically or lead to widespread outbreaks, epidemics, or even pandemics [2, 3]. There are three main types of influenza viruses: A, B, and C [5]. Type A infects both humans and animals and is responsible for most influenza pandemics, while type B is restricted to humans and occasionally causes seasonal epidemics [6-9]. Type C is less common and typically associated with mild illness. Among the subtypes of influenza A, H1N1 is particularly notable. It caused the 2009 global pandemic and is believed to have been the agent behind the 1918 “Spanish flu” pandemic, which infected over 500 million people and caused an estimated 50 to 100 million deaths—equivalent to 3% to 5% of the global population [10, 11]. Although the H1N1 strain originated in swine, human-to-human transmission occurs via respiratory droplets or contact with contaminated surfaces, rather than direct contact with pigs [12, 13].
H1N1 infection can vary in severity, ranging from mild, self-limiting illness to severe respiratory complications such as pneumonia and acute respiratory distress syndrome (ARDS). While mild cases may not require hospitalization, severe cases demand timely intervention, including antiviral therapy and supportive care [14]. Given the serious complications of influenza in certain high-risk groups, it is crucial to identify which populations are most vulnerable and need preventive measures. Additionally, with the emergence of the Coronavirus disease (COVID-19) and the overlap in symptoms between COVID-19 and influenza [15], it has become necessary to collect epidemiological, clinical and paraclinical information specific to our region. In addition, this study represents the first epidemiological and laboratory investigation of influenza in Yazd Province in recent years. The primary objective of this study was to analyze the epidemiological patterns and laboratory findings of hospitalized influenza patients, to support the establishment of an influenza registry.
Materials and Methods
Sample selection
This descriptive cross-sectional study was conducted on patients with a clinical diagnosis of influenza at Shahid Sadoughi Hospital in Yazd from March 2023 to March 2024. Participants were selected using a convenience sampling method based on their availability.
Inclusion criteria: Patients over 18 years of age with polymerase chain reaction (PCR) confirmed influenza and clinical manifestations, as evaluated by an infectious disease or internal medicine specialist at the hospital.
Exclusion criteria: Patients with incomplete medical records or those discharged at their own request.
Procedure
Information collected included age, gender, underlying diseases, pregnancy status, and a history of immunosuppressive drug use (e.g., corticosteroids). Clinical symptoms recorded were fever, cough, shortness of breath, weakness, lethargy, headache, diarrhea, sore throat, anorexia, and myalgia. Additionally, data on relative recovery and laboratory findings including complete blood count (CBC), creatinine, alanine aminotransferase (ALT), aspartate aminotransferase (AST), lactate dehydrogenase (LDH), C-reactive protein (CRP), and erythrocyte sedimentation rate (ESR) were extracted from medical records.
Statistical analysis
Data were entered into SPSS, version 26, and analyzed using the Chi-Square test and ANOVA test. P < 0.05 was assumed significant.
Results
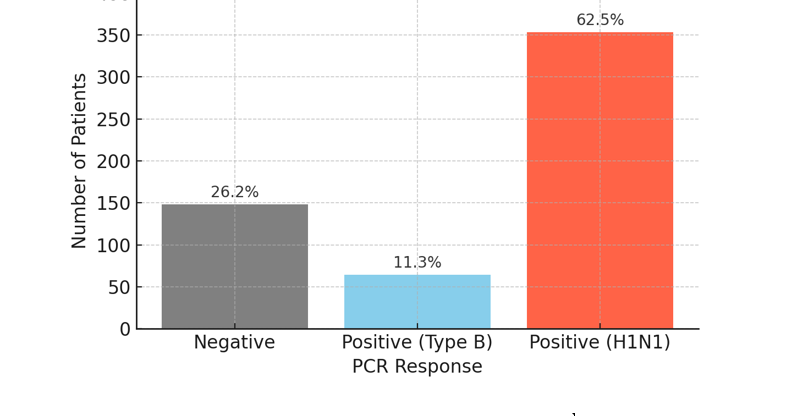
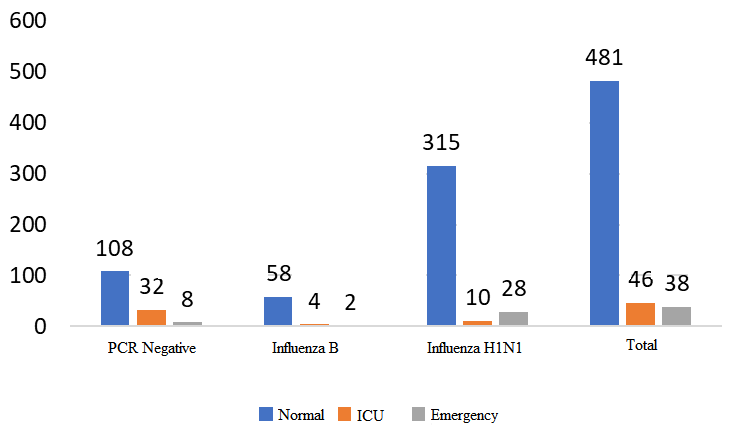
The minimum and maximum lengths of hospitalization were 1 and 45 days, respectively. The most frequent durations of hospitalization were 4 days, 5 days, and 3 days, with frequencies of 114, 113, and 82 patients, respectively. Additionally, 3% of patients required hospitalization for more than 2 weeks. The frequency of PCR results is shown in Table 1. Figure 1 shows the distribution of PCR responses among 565 hospitalized patients. As shown in Table 1 and Figure 1, a positive PCR result was found in 417 patients (73.8%) [the total of positive (type B) and positive (H1N1)]. Figure 2 shows the frequency of patients in the inpatient ward [infectious ward (normal), intensive care unit (ICU), emergency room]. Table 2 illustrates the distribution of patients among the negative PCR, Influenza B, and H1N1 influenza groups according to demographic characteristics, including age range, gender, inpatient department, status of pregnancy, and month of hospitalization.
H1N1 infection can vary in severity, ranging from mild, self-limiting illness to severe respiratory complications such as pneumonia and acute respiratory distress syndrome (ARDS). While mild cases may not require hospitalization, severe cases demand timely intervention, including antiviral therapy and supportive care [14]. Given the serious complications of influenza in certain high-risk groups, it is crucial to identify which populations are most vulnerable and need preventive measures. Additionally, with the emergence of the Coronavirus disease (COVID-19) and the overlap in symptoms between COVID-19 and influenza [15], it has become necessary to collect epidemiological, clinical and paraclinical information specific to our region. In addition, this study represents the first epidemiological and laboratory investigation of influenza in Yazd Province in recent years. The primary objective of this study was to analyze the epidemiological patterns and laboratory findings of hospitalized influenza patients, to support the establishment of an influenza registry.
Materials and Methods
Sample selection
This descriptive cross-sectional study was conducted on patients with a clinical diagnosis of influenza at Shahid Sadoughi Hospital in Yazd from March 2023 to March 2024. Participants were selected using a convenience sampling method based on their availability.
Inclusion criteria: Patients over 18 years of age with polymerase chain reaction (PCR) confirmed influenza and clinical manifestations, as evaluated by an infectious disease or internal medicine specialist at the hospital.
Exclusion criteria: Patients with incomplete medical records or those discharged at their own request.
Procedure
Information collected included age, gender, underlying diseases, pregnancy status, and a history of immunosuppressive drug use (e.g., corticosteroids). Clinical symptoms recorded were fever, cough, shortness of breath, weakness, lethargy, headache, diarrhea, sore throat, anorexia, and myalgia. Additionally, data on relative recovery and laboratory findings including complete blood count (CBC), creatinine, alanine aminotransferase (ALT), aspartate aminotransferase (AST), lactate dehydrogenase (LDH), C-reactive protein (CRP), and erythrocyte sedimentation rate (ESR) were extracted from medical records.
Statistical analysis
Data were entered into SPSS, version 26, and analyzed using the Chi-Square test and ANOVA test. P < 0.05 was assumed significant.
Results
The minimum and maximum lengths of hospitalization were 1 and 45 days, respectively. The most frequent durations of hospitalization were 4 days, 5 days, and 3 days, with frequencies of 114, 113, and 82 patients, respectively. Additionally, 3% of patients required hospitalization for more than 2 weeks. The frequency of PCR results is shown in Table 1. Figure 1 shows the distribution of PCR responses among 565 hospitalized patients. As shown in Table 1 and Figure 1, a positive PCR result was found in 417 patients (73.8%) [the total of positive (type B) and positive (H1N1)]. Figure 2 shows the frequency of patients in the inpatient ward [infectious ward (normal), intensive care unit (ICU), emergency room]. Table 2 illustrates the distribution of patients among the negative PCR, Influenza B, and H1N1 influenza groups according to demographic characteristics, including age range, gender, inpatient department, status of pregnancy, and month of hospitalization.
Table 1. The frequency of polymerase chain reaction results
| Number (%) | Polymerase chain reaction response |
| 148 (26.2) | Negative |
| 64 (11.3) | Positive (type B) |
| 353 (62.5) | Positive (H1N1) |
| 565 (100) | Total |
Fig. 1. Distribution of polymerase chain reaction responses among 565 hospitalized patients
Fig. 2. The frequency of patients in terms of inpatient wards
Table 2. The distribution of patients in different groups in terms of demographic variables
| Variables | Negative PCR N (%) |
Influenza B virus N (%) |
H1N1 influenza N (%) |
Total N (%) |
P-value |
| Gender Men Women |
69 (46.6) 79 (53.4) |
33 (51.6) 31 (48.4) |
171 (48.4) 182 (51.6) |
273 (48.3) 292 (51.7) |
0.82 |
| Age range < 30 30-39 40-49 50-59 60-69 70-79 ≥ 80 |
18 (12.2.) 36 (24.3) 23 (15.5) 17 (11.5) 18 (12.2) 21 (14.2) 15 (10.1) |
7 (10.9) 12 (18.8) 27 (42.2) 7 (10.9) 2 (3.1) 3 (4.7) 6 (9.4) |
31 (8.8) 57 (16.1) 48 (13.6) 58 (16.4) 67 (19) 57 (16.1) 35 (9.9) |
56 (9.9) 105 (18.6) 98 (17.3) 82 (14.5) 87 (15.4) 81 (14.3) 56 (9.9) |
<0.001 |
| Inpatient department Ward Intensive care unit Emergency |
108 (73) 32 (21.6) 8 (5.4) |
58 (90.6) 4 (6.3) 2 (3.1) |
315 (89.2) 10 (2.8) 28 (7.9) |
481 (85.1) 46 (8.1) 38 (6.7) |
<0.001 |
| Status of pregnancy No Yes |
139 (93.9) 9 (6.1) |
62 (96.9) 2 (3.1) |
341 (96.6) 12 (3.4) |
542 (95.9) 23 (4.1) |
0.35 |
| Month of Hospitalization January February March April May June July August September October November December |
27 (18.2) 3 (20) 7 (4.7) 3 (2) 1 (0.7) 3 (2) 1 (0.7) 0 (0) 4 (2.7) 22 (14.9) 51 (34.5) 26 (17.6) |
16 (25) 13 (20.3) 7 (10.9) 7 (10.9) 3 (4.7) 4 (6.3) 3 (4.7) 0 (0) 0 (0) 1 (1.6) 2 (3.1) 8 (12.5) |
23 (6.5) 2 (0.6) 0 (0) 1 (0.3) 0 (0) 0 (0) 5 (1.4) 0 (0) 15 (4.2) 77 (21.8) 162 (45.9) 68 (19.3) |
66 (11.7) 18 (3.2) 14 (2.5) 11 (1.9) 4 (0.7) 7 (1.2) 9 (1.6 0 (0) 19 (3.4) 100 (17.7) 215 (38.1) 102 (18.1) |
<0.001 |
PCR= Polymerase chain reaction
As shown in Table 2, there was a significant difference among the groups in terms of age range. In the overall patient population, the 30-39 age group had the highest rate of hospitalization due to illness, followed by the 40-49 age group. Although there were fewer patients aged over 80 and under 30 compared to other age groups, the difference was not statistically significant. Contrary to the general trend, the highest incidence of influenza B occurred in the 40-49 age group (42.2%), which showed a significant difference compared to other age groups. The most common age range for H1N1 infection was 60-69 years (p < 0.05).
Among the hospitalized patients, 481 were admitted to the infectious disease or internal medicine departments, while 46 patients were admitted to the ICU due to deterioration in their condition and the need for more intensive care. Additionally, 38 patients were admitted to the emergency department and later discharged. The results showed that out of the 46 patients admitted to the ICU with a diagnosis of influenza, only 10 had H1N1 influenza, 4 had influenza B, and the remaining 32 patients (69%) had influenza-like illness. The data indicated no significant difference between influenza B and H1N1 influenza in terms of overall hospitalization rates (p> 0.05). However, patients diagnosed with influenza were significantly more likely to be hospitalized in the general wards (p < 0.05). The highest prevalence of the disease occurred in November. Across the autumn months, the highest rate of hospitalizations due to influenza was observed. With the onset of winter, the number of cases decreased, reaching its lowest level in August, when no cases of hospitalized influenza were reported. The incidence of negative PCR and H1N1 cases started increasing in September, peaked in November, and then declined. In contrast, influenza B started with a low prevalence in October and reached its peak in January (25%) and February (20%) before declining. H1N1 influenza had the lowest prevalence in the spring, with only one case out of 22 hospitalized patients diagnosed with H1N1; 14 patients had influenza B, and 7 had other illnesses. These findings suggest that in cases of clinical suspicion of influenza during the spring, influenza B should be the primary consideration, followed by other viral diseases, with H1N1 being less likely. Conversely, in autumn, H1N1 should be the top diagnostic consideration, while influenza B is less likely to occur (p < 0.05).
Table 3 presents the comparison of patient frequencies across different groups based on clinical variables. Fever and cough were the most common symptoms in patients with influenza, with prevalence of 58.9% and 57.7%, respectively. Shortness of breath and myalgia were also common, affecting 44.4% and 23.7% of patients. Coryza was present in only 10% of patients. In some cases, digestive symptoms were observed. There was a significant difference among the groups in terms of fever, cough, and shortness of breath, nausea, and vomiting (p < 0.05). A total of 65 patients had underlying conditions based on Centers for Disease Control and Prevention criteria. The most common condition was hypertension, present in 63 patients, and this showed a significant association with influenza (p < 0.05). Chronic obstructive pulmonary disease was the second most common underlying condition, affecting 46 hospitalized patients. The frequency of clinical outcomes of patients is shown in Table 4.
Table 3. The comparison of patient frequencies across different groups based on clinical variables
| Variables | Negative PCR N (%) |
Influenza B virus N (%) |
H1N1 influenza N (%) | Total N (%) |
P-value |
| Use of immunosuppressive drugs and corticosteroids No Yes |
148 (100) 0 (0) |
62 (96.9) 2 (3.1) |
353 (100) 0 (0) |
563 (99.6) 23 (4.1) |
0.6 |
| Underlying disease Hypertension Chronic obstructive Pulmonary disease Malignancy Coronary artery disease Asthma Chronic kidney disease Cerebrovascular accident |
11 (7.4) 6 (4.1) 10 (6.8) 4 (2.7) 3 (20) 3 (20) 4 (2.7) |
3 (4.7) 6 (9.4) 0 (0) 0 (0) 0 (0) 2 (3.1) 1 (1.6) |
49 (13.9) 34 (9.6) 15 (4.2) 21 (5.9) 15 (4.2) 12 (3.4) 5 (1.4) |
63 (11.2) 46 (8.1) 25 (4.4) 25 (4.4) 18 (3.2) 17 (30) 10 (1.8) |
0.024 0.106 0.087 0.051 0.132 0.713 0.603 |
| Clinical signs Fever Cough Shortness of breath Myalgia Anorexia Headache Sore-throat Diarrhea Abdominal pain Nausea and vomiting Infectious coryza Weakness and lethargy Chest pain |
70 (47.3) 68 (45.9) 52 (35.1) 35 (23.6) 5 (3.4) 16 (10.8) 5 (3.4) 11 (7.4) 5 (3.4) 14 (9.5) 13 (8.8) 20(13.5) 3 (20) |
43 (67.2) 34 (53.1) 17 (26.6) 12 (18.8) 5 (7.8) 8 (12.5) 6 (9.4) 4 (6.3) 1 (1.6) 12 (18.8) 12 (18.8) 12 (18.8) 1 (1.6) |
220 (62.3) 224 (63.5) 182 (51.6) 87 (24.6) 24 (6.8) 42 (11.9) 13 (3.7) 31 (8.8) 13 (3.7) 65 (18.4) 32 (9.1) 67 (19) 13 (3.7) |
333 (58.9) 326 (57.7) 251 (44.4) 134 (23.7) 34 (6) 66 (11.7) 24 (4.2) 46 (8.1) 19 (3.4) 91 (16.1) 57 (10.1) 99 (17.5) 17 (3) |
0.003 0.001 < 0.001 0.549 0.277 0.920 0.096 0.741 0.678 0.038 0.05 0.328 0.473 |
PCR= Polymerase chain reaction
Table 4. The frequency of clinical outcomes of patients
| Diagnosis of influenza | Clinical outcome | N (%) |
| Based on clinical symptoms | Recovery Transfer to another center Death |
536 (94.9) 3 (0.5) 26 (4.6) |
| Based on positive PCR | Recovery Transfer to another center Death |
396 (94.9) 1 (0.2) 20 (4.7) |
PCR= Polymerase chain reaction
In Clinical symptoms: of the 565 patients, 536 recovered and were discharged, 3 were transferred to other centers, and 26 died. Among the deceased, 18 had H1N1 influenza, 2 had influenza B, and 5 had other illnesses. Among the H1N1 influenza deaths, 10 were men and 8 were women. No significant difference was observed in clinical outcomes between the three groups or between genders (p> 0.05). Out of 565 patients, 417 had a positive PCR result, and 396 of these patients recovered and were discharged. One patient was transferred to another center, and 20 died. Among the deaths, 18 were due to H1N1 influenza, and two were due to influenza B. Again, no significant difference in clinical outcomes was found between the three groups or between genders in patients with positive influenza PCR results (p> 0.05). Table 5 shows the mean and standard deviation of laboratory findings.
Table 5. The mean and standard deviation of laboratory findings
| Laboratory findings | Number | Mean ± SD | |
| White blood cell | Negative PCR Influenza B virus H1N1 influenza |
131 62 349 |
9764 ± 595 6800± 5749 8134 ± 7924 |
| Lymphocyte (%) | Negative PCR Influenza B virus H1N1 influenza |
120 56 320 |
23.16±16.76 28.27±18.27 20.24±14.24 |
| Neutrophil (%) | Negative PCR Influenza B virus H1N1 influenza |
120 56 320 |
71.26±17.90 66.26± 18.60 73.80± 15.59 |
| Platelet | Negative PCR Influenza B virus H1N1 influenza |
131 62 349 |
267358±122270 206919± 110130 226449±115291 |
| Hemoglobin | Negative PCR Influenza B virus H1N1 influenza |
131 62 346 |
12.40±2.1 11.94±2.04 12.46±2.28 |
| Erythrocyte sedimentation rate | Negative PCR Influenza B virus H1N1 influenza |
100 56 268 |
54.34±30.65 46.13±30.50 44.23± 29.39 |
| Aspartate aminotransferase | Negative PCR Influenza B virus H1N1 influenza |
91 48 271 |
46.04±109.73 47.33±47.43 44.58±118.34 |
| Alanine aminotransferase | Negative PCR Influenza B virus H1N1 influenza |
91 48 270 |
39.84±85.79 39.00±50.09 37.27±91.20 |
| Lactate dehydrogenase | Negative PCR Influenza B virus H1N1 influenza |
26 21 82 |
599.08± 564.46 537.62± 324.21 549.83± 320.94 |
| Oxygen saturation upon arrival | Negative PCR Influenza B virus H1N1 influenza |
26 21 82 |
91.67±3.15 92.02±92.02 91.55±3.44 |
| Oxygen saturation upon discharge | Negative PCR Influenza B virus H1N1 influenza |
148 64 353 |
95.66±2.82 95.49±3.68 95.13±3.26 |
PCR= Plymerase chain reaction
There was no significant difference in white blood cell (WBC) count between influenza A and negative cases. However, statistical analysis showed that in influenza B cases, the WBC count was significantly lower than in negative cases (p= 0.02). In terms of neutrophil and lymphocyte percentages, the highest percentage of neutrophils was found in influenza A cases (73.80%), while the lowest was in influenza B cases (66.26%). The opposite pattern was observed for lymphocytes. This difference was significant (p= 0.001). However, no significant difference was found between negative and positive cases. Platelet counts in both influenza A and B patients were significantly lower than in patients without influenza (p = 0.002). For the other laboratory parameters, no significant differences were observed between the groups.
Discussion
Our study shows that out of a total of 565 patients suspected of having influenza, PCR results were positive for 417 patients (73.8%), of which 64 (11.3%) tested positive for the B strain and 353 (62.5%) for the H1N1 strain, with PCR-negative cases accounting for 26.2%. The remaining patients had other illnesses. This result indicates that H1N1 was the most frequent strain detected.
In the study by Ayora-Talavera et al., 53% of the patients were infected with H1N1 [16]. In contrast, a study by Pandita et al. in India found that only 30% of patients were infected with H1N1 [17]. These differences may be due to varying diagnostic criteria, different prevalence of disease strains, or differing methods and tools used for PCR testing.
Most hospitalized patients were in the age group of 30-39 years. However, for influenza B, the most common age group was 40-49 years (42.2%), which showed a significant difference compared to other age groups. A similar finding was observed in the study by Kim et al., indicating that the average age of influenza B infection was higher [18].
Among the patients hospitalized for influenza B or H1N1, most were admitted to the general ward (about 90%), while PCR-negative patients had a significantly higher rate of ICU admissions (21.6%). These results suggest that when a patient requires hospitalization in the intensive care unit, the likelihood of a disease other than influenza increases.
The most common clinical symptoms of H1N1 were fever, cough, and shortness of breath, which were present in 62.3%, 63.5%, and 51.6% of patients, respectively. Myalgia (24.6%), weakness and lethargy (19%), and nausea and vomiting (18.4%) also ranked next in terms of symptom prevalence. Sore throat was noted in 13 patients (3.7%), and symptoms of coryza were present in 9.1% of patients, making these among the less common symptoms.
In the study by Ling et al., fever (91%) and cough (88%) were the most common symptoms of the disease [19]. However, this study also reported a high prevalence of sore throat (66%) and rhinorrhea (56%) among patients. In the study by Mehta et al., fever (97.7%), cough (86.4%), and shortness of breath (45.45%) were also the most common symptoms, similar to our findings. However, sore throat was reported as one of the common symptoms of influenza as well [20]. Many other studies have also reported similar symptoms [21-24].
Khandaker et al. assessed the clinical symptoms in patients with H1N1 influenza and reported that cough (84.9%) and fever (84.7%) were the most common symptoms in patients with H1N1 influenza [25]. The study by Kaji et al. also stated that there was no difference in the presence of fever between H1N1 and influenza B [26]. However, this study reported that influenza B cases exhibited more severe gastrointestinal symptoms, whereas our study found no difference between the two types of influenza. In contrast, the research by Kim and colleagues showed that cough, sputum, rhinorrhea, vomiting, diarrhea, and headache were more prevalent in influenza B infections compared to H1N1 infections [18].
In the current study, the lowest level of lymphocytes was observed in patients with H1N1 influenza. Oh et al. compared hematological factors in patients with influenza A and B and revealed that the proportion of neutrophils was higher in influenza A than in influenza B infections, although the values were within normal limits for both influenza types [27]. This indicates that neutrophil count alone may not be a definitive marker for distinguishing between influenza types.
Wang et al. studied 150 children with H1N1 who tested positive for the rapid influenza diagnostic test, 152 children with negative H1N1 tests, and 75 children with influenza-like illness but not H1N1 [28]. They found that combining a low lymphocyte count with a low CRP level in the early stages of illness could help screen for H1N1 in children with false-negative rapid influenza diagnostic test results, aiding in differential diagnosis.
Wang et al. also examined hematologic markers in H1N1 cases and noted a decrease in total lymphocytes in some instances. Additionally, the counts of T lymphocyte subgroups were significantly reduced in the acute phase, dropping to very low levels after a few days before returning to normal during recovery [29]. The researchers concluded that T lymphocyte subgroups could be used as markers to track the progression of H1N1, offering valuable insights for early diagnosis, disease monitoring, and prognosis evaluation. These findings provide important hematologic criteria for improving the accuracy of H1N1 diagnosis and treatment monitoring. Regarding the months of illness onset, significant differences were observed among the groups. The cases of PCR-negative and H1N1 peaked in November, reaching their peak in January (25%) and February (20%) before declining. Influenza H1N1 had the lowest prevalence in the spring months; among 22 hospitalized patients, only one had H1N1, while 14 had influenza B and 7 had other diseases. The study by Kim et al. also reported a higher prevalence of influenza B in the spring [18]. These results suggest that if there is a clinical suspicion of influenza in the spring season, influenza B should be prioritized in the differential diagnosis, with other viral diseases occurring before H1N1. Conversely, in the fall, H1N1 is the primary diagnosis, while influenza B has the lowest likelihood of occurrence. Similar results have been reported in studies conducted in Mexico, Singapore, and Italy [16, 30, 19]. In the study by Kang et al., the highest prevalence of influenza was also reported in November [31]. In contrast, studies in India reported that the highest prevalence of the disease occurred in January, February, and March. This statistical difference may be due to climatic and geographical variations among countries [17, 32, 33].
In our study, 18 PCR-confirmed H1N1 patients died, resulting in a mortality rate of 5.1%, while the remaining patients were discharged after recovery. Among the 18 fatalities, 8 were women and 10 were men. No statistically significant differences in clinical outcomes were observed based on PCR status or gender. In a study conducted by Afzali et al. in Kashan, involving 86 hospitalized patients, the reported mortality rate was 8.1%, with two female and seven male deaths [34]. In comparison, a hospital-based study in India reported a mortality rate of 11%, with 236 confirmed cases and 26 deaths [35]. Lower mortality rates were observed in other countries, including Guatemala (2.7%; 6 deaths among 198 confirmed cases) [36], southeastern Brazil (1.8%) [37], and the United States (7%) [38].
Although the mortality rate observed in our study is lower than that in India and the United States, it remains higher than rates reported in Guatemala and Brazil. This highlights the clinical severity of H1N1 infection in hospitalized patients in our region. Several potential contributing factors may explain this mortality rate, such as delayed healthcare-seeking behavior, underlying comorbidities, or limited access to critical care services.
Nonetheless, the findings underscore the need for improved early detection, timely antiviral therapy, and enhanced preparedness to manage severe H1N1 cases more effectively at the local level.
Conclusion
Prominent clinical symptoms and laboratory findings, such as decreased platelet counts and altered neutrophil and lymphocyte ratios, were key in supporting the diagnosis of influenza, especially H1N1. While most patients recovered, the higher mortality among H1N1 cases highlights the importance of early diagnosis, prompt treatment, and seasonal preparedness. In summary, this study can serve as a basis for physicians and public health personnel to understand the clinical-epidemiological characteristics of H1N1 influenza cases for analysis, treatment, and the development of preventive strategies in the near future. The fall months are associated with a significant increase in cases, often accompanied by clinical symptoms such as fever, shortness of breath, and cough. In our study, influenza B and H1N1 strains were examined using PCR tests, while other strains, such as H3N2, can also spread during disease outbreaks. Additionally, with the emergence of the COVID-19 virus, which can present symptoms similar to influenza in many cases, it is recommended that similar studies be conducted, including COVID testing and other influenza strains. Given the potential for recurrent influenza epidemics in the future, further evaluation of various characteristics depending on the type of virus and preparation for them is essential.
Ethical Considerations
This study was approved by the Ethical Committee of Shahid Sadoughi University of Medical Sciences (IR.SSU.MEDICINE.REC.1402.259).
Funding Statement
None.
Conflict of Interest
The author declared no conflict of interest.
Acknowledgements
We would like to thank the staff of the infectious disease department for their sincere support.
Data Availability Statement
The data presented in this study are available on request from the corresponding author.
Authors’ Contribution
F.H, AS.AB, J.A, designed, collected, and edited the manuscript, SA.MA, M.Sh, and Z.A. wrote the draft, edited it, and interpreted the statistical analysis.
References
- Webster RG, Govorkova EA. Continuing challenges in influenza. Ann N Y Acad Sci. 2014; 1323(1): 115-39.
- Palese P. Influenza: old and new threats. Nat Med. 2004; 10(S 12): 82-7.
- Nitsch-Osuch A, Wozniak-Kosek A, Korzeniewski K, Zycinska K, Wardyn K, Brydak LB. Clinical features and outcomes of influenza A and B infections in children. Neurobiol Respir. 2013: 89-96.
- Kilbourne ED. Influenza. New York: Springer Science & Business Media; 2012.
- Cox NJ, Subbarao K. Global epidemiology of influenza: past and present. Annu Rev Med. 2000; 51(1): 407-21.
- Pretorius MA. The role of influenza, RSV and other common respiratory viruses in severe acute respiratory infections and influenza-like illness in a population with a high HIV sero-prevalence, South Africa 2012-2015. J Clin Virol. 2016; 75: 21-6.
- Aktürk H. Evaluation of epidemiological and clinical features of influenza and other respiratory viruses. Turk Arch Pediatr. 2015; 50(4): 217.
- Kilbourne ED. Influenza pandemics of the 20th century. Emerg Infect Dis. 2006; 12(1): 9.
- Webster RG. Influenza: an emerging disease. Emerg Infect Dis. 1998; 4(3): 436.
- Potter CW. A history of influenza. J Appl Microbiol. 2001; 91(4): 572-79.
- Sullivan SJ, Jacobson RM, Dowdle WR, Poland GA. 2009 H1N1 Influenza. Mayo Clin Proc. 2010; 85(1): 64-76.
- Rewar S, Mirdha D, Rewar P. Treatment and prevention of pandemic H1N1 influenza. Ann Glob Health. 2015; 81(5): 645-53.
- Keenliside J. Pandemic influenza A H1N1 in swine and other animals. In: Morilla A, Yoon KJ, Zimmerman JJ, editors. Swine Influenza. Ames: Wiley-Blackwell; 2012. p. 259-71.
- Rao S. A comparison of H1N1 influenza among pediatric inpatients in the pandemic and post-pandemic era. J Clin Virol. 2015; 71: 44-50.
- Osman M, Klopfenstein T, Belfeki N, Gendrin V, Zayet S. A comparative systematic review of COVID-19 and influenza. Viruses 2021; 13(3): 452.
- Ayora-Talavera G, López-Martínez I, Aréchiga-Ceballos N, Ramírez-González JE, Santos-Preciado JI. Epidemiologic study of human influenza A (H1N1) pdm09 virus in Yucatan, Southern Mexico. Rev Biomed. 2012; 23(2): 39-46.
- Pandita AK, Bhatt R, Arya A, Sharma A, Kumar R. Clinico-epidemiological profile of Influenza A H1N1 cases at a tertiary care institute of Uttarakhand. J Family Med Prim Care. 2021; 10(3): 1258-262.
- Kim SH, Kim YH, Kim KH, Kim YJ, Lee SY. Comparison of clinical manifestation and laboratory findings between H1N1 and influenza B infection. Pediatr Allergy Respir Dis. 2012; 22(1): 64-70.
- Ling LM, Chow ALP, Lye DC, Tan AS, Krishnan P, Ferguson D, et al. Effects of early oseltamivir therapy on viral shedding in 2009 pandemic influenza A (H1N1) virus infection. Clin Infect Dis. 2010; 50(7): 963-69.
- Mehta AA, Sharma A, Jindal A, Sharma N, Sharma R, Mehta S. Clinical profile of patients admitted with swine-origin influenza A (H1N1) virus infection: an experience from a tertiary care hospital. J Clin Diagn Res. 2013; 7(10): 2227-230.
- Chudasama RK, Patel UV, Verma PB, Amin CD, Savaria D, Ninama R, et al. Clinico-epidemiological features of the hospitalized patients with 2009 pandemic influenza A (H1N1) virus infection in Saurashtra region, India (September 2009 to February 2010). Lung India. 2011; 28(1): 11-6.
- Puvanalingam A, Rajendiran S, Sivasubramanian S, Ragunanthanan S, Suresh S, Gopalakrishnan S. Case series study of the clinical profile of H1N1 swine flu influenza. J Assoc Physicians India 2011; 59: 14-6.
- Amaravathi K, Sakuntala P, Sudarsi B, Manohar S, Nagamani R, Rao S. Clinical profile and outcome of recent outbreak of influenza A H1N1 (swine flu) at a tertiary care center in Hyderabad, Telangana. Ann Trop Med Public Health. 2015; 8(6): 267-72.
- Denholm JT, Gordon CL, Johnson PD, Hewagama SS, Stuart RL, Aboltins C, et al. Hospitalised adult patients with pandemic (H1N1) 2009 influenza in Melbourne, Australia. Med J Aust. 2010; 192(2): 84-6.
- Khandaker G, Dierig A, Rashid H, King C, Heron L, Booy R. Systematic review of clinical and epidemiological features of the pandemic influenza A (H1N1) 2009. Influenza Other Respir Viruses. 2011; 5(3): 148-56.
- Kaji M, Watanabe A, Aizawa H. Differences in clinical features between influenza A H1N1, A H3N2, and B in adult patients. Respirology 2003; 8(2): 231-33.
- Oh YN, Kim S, Choi YB, Woo SI, Hahn YS, Lee JK. Clinical similarities between influenza A and B in children: a single-center study, 2017/18 season, Korea. BMC Pediatr. 2019; 19: 1-8.
- Wang L, Chang LS, Lee IK, Tang KS, Li CC, Eng HL, et al. Clinical diagnosis of pandemic A (H1N1) 2009 influenza in children with negative rapid influenza diagnostic test by lymphopenia and lower C-reactive protein levels. Influenza Other Respir Viruses 2014; 8(1): 91-8.
- Wang N, Liu X, Zhang Y, Xie Y, Zhao W. Hematologic markers of influenza A H1N1 for early laboratory diagnosis and treatment assessment. Lab Med. 2011; 42(10): 607-11.
- Di Giambenedetto S, Zileri Dal Verme L, Sali M, Farina S, Di Cristo V, Manzara S, et al. Effects of early oseltamivir therapy on viral shedding in 2009 pandemic influenza A (H1N1) virus infection. Clin Infect Dis. 2010; 50(7): 963-69.
- Kang TG, Kim MJ, Kim BG, An HS, Yun HJ, Choi EJ, Jung JA. Comparisons of clinical features among influenza A (H1N1) and seasonal influenza A and B during 2009 to 2010 at a single institution. Pediatr Allergy Respir Dis. 2011; 21(4): 269-76.
- Sujatha K, Murali V, Rao BB, Kathi A. A clinical and epidemiological study of H1N1 cases at a tertiary care hospital in Hyderabad, Telangana. Strategies. 2016; 7: 10.
- Jayadeva B, Chikkananjaiah N, Gowda V, Rani D, Poovathingal S. Clinical profile of suspected and confirmed H1N1 influenza infection in patients admitted at a tertiary care teaching hospital. J Cardio Thorac Med. 2015; 3(4): 367-70.
- Afzali H, Nematian M, Rajabi J, Soleimani Z, Momen-Heravi M, Salehi A, et al. Epidemiological survey of confirmed influenza A (H1N1) in Kashan, Aran and Bidgol cities during 2009-10. Feyz Med Sci J. 2011; 15(3): 259-66.
- Yadav A, Samra T, Pawar M. H1N1 epidemic: Our experience at PGIMER Delhi, India. Int J Infect Dis. 2010; 14: 96.
- Loutan L. 14th International Congress on Infectious Diseases. Int J Infect Dis. 2010; 14: 72-478.
- Feltrin A, Augusto K, Carvalho J, Vitone J, Silva A, Morelli J, et al. Severe acute respiratory disease caused by pandemic influenza A H1N1 virus: A case series of hospitalized patients in Southeastern Brazil during the 2009 epidemic. Int J Infect Dis. 2010; 14: 106.
- Jain S, Kamimoto L, Bramley AM, Schmitz AM, Benoit SR, Louie J, et al. Hospitalized patients with 2009 H1N1 influenza in the United States, April-June 2009. N Engl J Med. 2009; 361(20): 1935-944.
Type of Study: Research |
Subject:
Virology
Received: 2025/05/12 | Accepted: 2025/08/17 | Published: 2024/10/31
Received: 2025/05/12 | Accepted: 2025/08/17 | Published: 2024/10/31
Send email to the article author
| Rights and permissions | |
 |
This work is licensed under a Creative Commons Attribution-NonCommercial 4.0 International License. |
