In clinical laboratories, a variety of techniques such as spectrophotometry, colorimetry, reflectometry, molecular luminescence spectroscopy (fluorometry), and refractometry are conventional methods to estimate biochemical concentrations in blood [1-5]. These procedures are usually based on the optical and spectral features of laboratory samples. In the spectrophotometry method, the absorption spectrum of samples is used in the analysis [1]. In the same way, the absorbance of colored compounds at a specific wavelength of light is used to determine the concentration of biological analytes in a solution in colorimetry [2]. In the reflectometry method, reflected light intensity is analyzed by a liquid sample dispensed onto gravity or fibrous solid support [4]. Besides, refractometry is used to determine protein content and a specific gravity of urine and examine column effluent protein performance in liquid chromatography [5]. The methods of nephelometry and turbidometry are used to determine the concentration of large particles such as antigen-antibody complexes by monitoring light scattered in a particle solution and light transmitted by a particle formation [4].
Due to their application in biophotonic devices [6] and the importance of studying biological processes in biological tissues [7], investigations on optical and nonlinear optical characteristics of biomolecules are still being considered. In addition to standard methods used in clinical labs, nonlinear optical approaches have recently been addressed for estimating biochemical analytes.
The laser-based Z-Scan technique established by Sheik-Bahae et al. [8, 9] due to its experimental simplicity for detecting nonlinear optical properties, nonlinear refraction, and nonlinear absorption coefficient, attracts more attention among various methods.
Recently, several works have been dedicated to evaluating the nonlinear optical properties of biochemical indigents in biological liquids such as blood, blood plasma, and blood serum, as well as quantitative analysis of nonlinear refractive indexes of these molecules in biological liquids. The nonlinear optical response of human standard and oxidized low-density lipoprotein particles (LDL) has been studied using the Z-Scan technique. Normal LDL particles' Z-Scan signals increase with concentration and temperature, whereas oxLDL particles exhibit no nonlinear optical behavior [10]. Also, the nonlinear refractive index (n2) of blood samples was used to analyze the blood glucose level [11]. According to the findings, blood's nonlinear refractive index could be used as a potential signal for determining glucose content. The results are consistent with those obtained using traditional colorimetric methods [12]. Furthermore, nonlinear optical characteristics were observed in blood serum samples including protein, albumin [13], urea, uric acid [14], cholesterol, and triglycerides [15]. Bovine serum albumin conjugated to Bradford dye has been demonstrated to have a nonlinear response [16]. Consequently, its nonlinear refractive index is considered for measuring the concentration values of albumin levels in various samples such as cerebro-spinal fluid blood and urine. The Z-Scan approach was used to investigate the nonlinear optical behavior of blood porphyrin in order to diagnose prostate cancer [17]. The results showed that the nonlinear optical indexes of standard protoporphyrin IX samples and blood samples are opposing. The nonlinear optical response of blood plasma containing creatinine particles was similar to the nonlinear optical response of blood and blood serum [18].
In this paper, the nonlinear optical responses of various biochemical analytes in blood serum, including glucose, triglycerides, and cholesterol, were re-investigated using the Z-Scan technique with more experimental data points and taking into account local processes in sample preparation in the first phase of a feasibility study of designing and fabricating commercial Z-Scan apparatus for medical applications. The findings inspire further research into the nonlinear optical properties of samples as a function of their concentration in biological liquids such as blood, serum, or blood plasma, as well as nonlinear optical property measurement of other biological tissues.
Materials and Methods
Z-Scan technique
The Z-Scan technique, as previously stated, is a method for measuring nonlinear optical characteristics such as nonlinear refraction and material absorption coefficient. This method is simple and fast in comparison to other techniques such as degenerate four-wave mixing [19], nonlinear interferometry [20], and elliptical rotation to measure nonlinear optical coefficients [21].
Fig. 1 shows a typical experimental setup generally used in the Z-Scan technique. This method is based on propagating the Gaussian laser beam in z-direction through the nonlinear samples. A convenient lens tightly focuses the beam with a positive short focal length in the sample, which moves in the z-direction. The intensity of transmitted light through the sample is measured along the axial direction after the narrow iris mounted in the optical axis by varying sample positions in the z-direction. Fig. 1(a) shows a typical closed aperture Z-Scan setup, which helps to estimate the sample's nonlinear refractive index. Fig .1(b) shows the open aperture Z-Scan setup which includes a lens after the sample to collect the transmitted beam and measure the beam intensity as a function of sample position. The open aperture Z-Scan setup is usually used for estimating the nonlinear absorption coefficient of the materials.
In this work, the Z-Scan experiment was accomplished using a 532 nm of Nd:YAG (SHG) CW laser beam with a maximum of 50 mW power. The beam was focused on the sample with a lens of 50 mm focal length. The sample was placed in a narrow quartz cuvette with an L=1 mm path length.
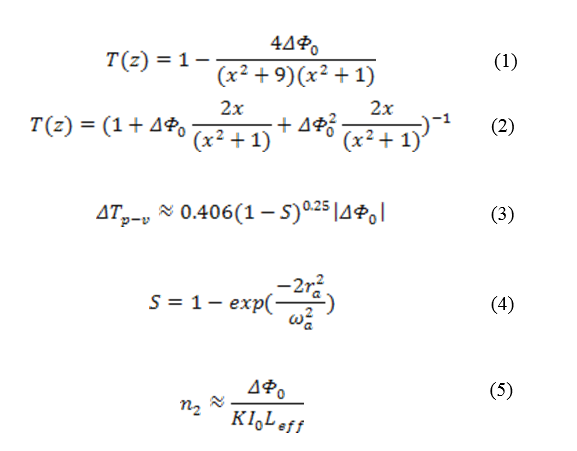
The estimation of the nonlinear refractive index of samples is based on the accurate recorded normalized transmittance curve of beam intensity regarding the sample's position, Z. The function of the normalized transmittance curve is described by equation (1). In Eq. 1, ∆Φ0 represents the phase change produced when the sample is transferred through the focal plane, and x=Z/ZR. The term ZR is Rayleigh dispersion defines as: ZR= πω02/λ
Furthermore, in cases of strong nonlinear absorption of the sample, the normalized transmittance does not have a symmetric peak and valley; the thermal lens model has been proposed to fit the normalized transmittance curve. This model is given by equation (2) [22]. Due to the weak laser beam intensity, the nonlinear absorption coefficient of samples cannot be investigated directly by open aperture configuration. The difference between normalized peak and valley transmittance can be derived by equation (3). Where S is linear transmittance of the aperture and is expressed by equation (4). Where rα is the radius of the aperture and ωα is the beam radius at the aperture. The nonlinear refractive index of the samples is resulted by the equation (5). Where I0=2P/(πω0) is the maximum intensity at the focal point, K is the wavenumber, and Leff is effective sample thickness and can be given by equation (6). In Eq. 6, α is the linear absorption coefficient and L is the sample's thickness.
.png)
Fig. 1. Schematic diagram of Z-Scan experimental setup for (a) CA= Closed aperture,
and (b) OA= Open aperture
Sample preparation
For sample processing, various blood serums were collected and prepared to investigate their nonlinear optical characteristics. Because human serums contain different biochemical analytes, their nonlinear refractive index is affected by all compounds. Hence, to assure nonlinear optical properties of samples associated with the presence of the specific biochemical analyte, blood serums were modified with reagents that were typically used in the photometric method for the quantitative determination of total glucose, triglycerides, and cholesterol concentration in human serum. For each set of samples, 1000 µl regent was added to 10 µl of prepared serum with varying amounts of glucose, triglycerides, and cholesterol independently and incubated at 37
o C for 10 minutes. The amount of quinonimine created in reactions is exactly proportional to the amount of glucose, triglycerides, and cholesterol present in each experimental sample. More details on chemical reactions in sample preparations are available in Ref. [23-25]. In total, fifteen samples: including five samples of glucose in serum with clinical concentrations of 74 mg/dl, 94 mg/dl, 121 mg/dl, 152 mg/dl, and 240 mg/dl, five samples of triglyceride in serum with concentrations of 66 mg/dl, 140 mg/dl, 251 mg/dl, 400 mg/dl, and 480 mg/dl, and samples of cholesterol in serum with clinical concentrations 133 mg/dl,153 mg/dl, 200 mg/dl, 247 mg/dl, 266 mg/dl were prepared and were used to evaluate the nonlinear optical responses of glucose, triglycerides and cholesterol in serum. It should be noted that the study procedure was approved by the Ethics Committee of Yazd University, Yazd, Iran.
Results
For studying samples' nonlinear response, initially, the laser beam with the most proper wavelength was selected by investigating the UV-Vis absorption spectra of samples. For instance, Fig. 2 shows the UV-Vis absorption spectra of samples containing glucose with 1000 µ

reagent in the 200 to 800 nm wavelength range. The data obtained for each sample and the graphs were treated using OriginPro software, where a Savitsky-Golay smoothing of 10 points was applied in order to appreciate better the behavior of the graphs.
As demonstrated in Fig. 2, the height of absorption peak at ~500 nm increases for greater glucose in serum. The appearance of a significant broadband feature around 500 nm in the recorded spectra of all samples led us to use a commercial laser with a wavelength of 532 nm in our experimental setup. This is noted that identical UV-Vis spectra are obtained for serum samples containing triglycerides and cholesterol.
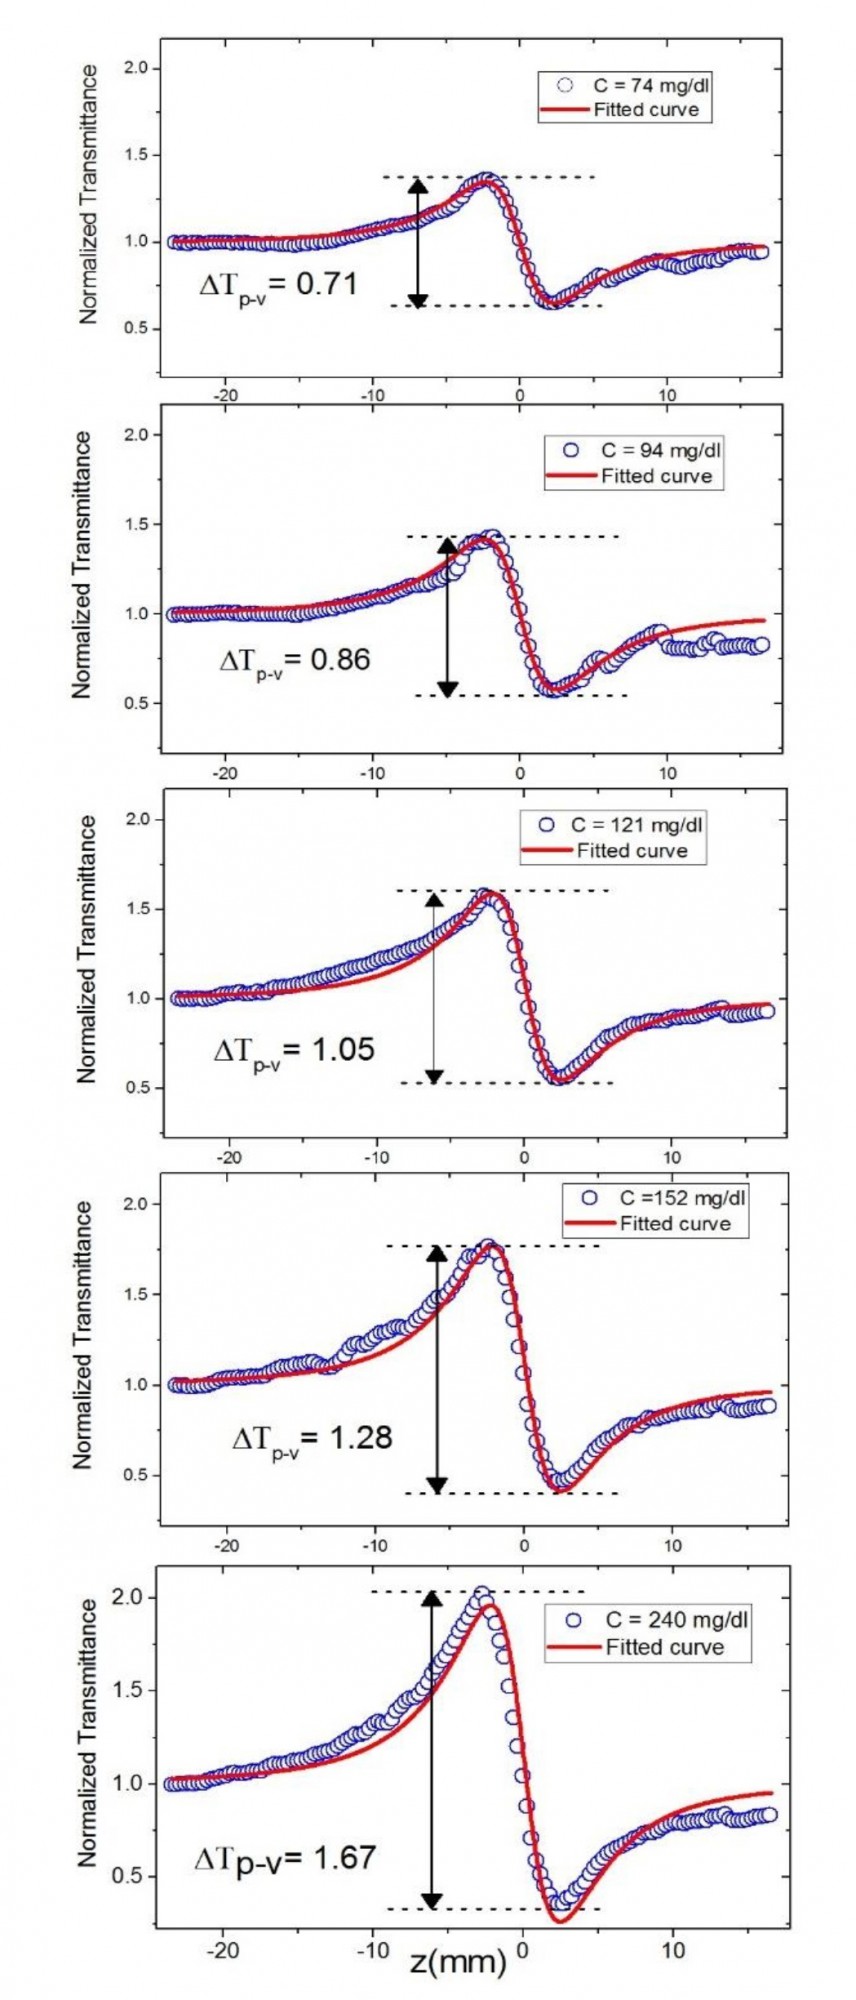
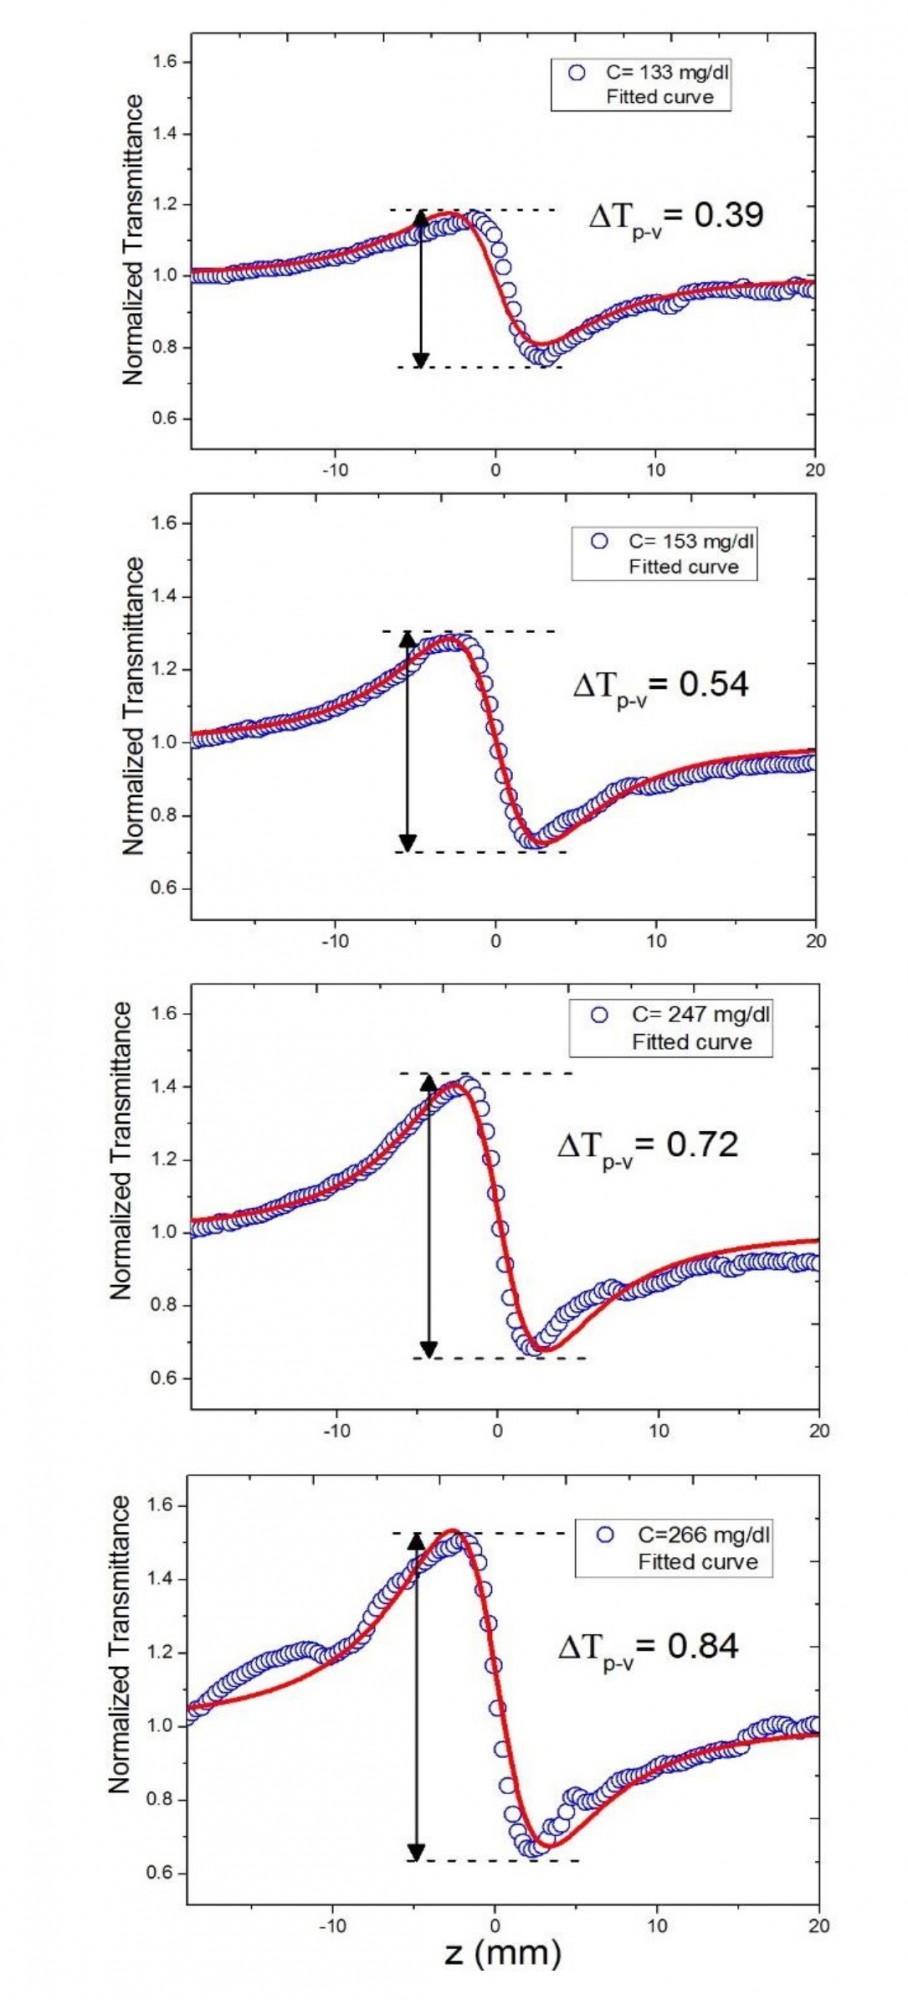
Fig. 3, 4, and 5 illustrate the results of a closed aperture (CA) configuration. The normalized transmittance curves through the serum with varying concentrations of glucose (Fig. 3), triglycerides (Fig. 4), and cholesterol (Fig. 5) with 1000 µl reagent are plotted as a function of sample position relative to the lens focal point location in these figures.
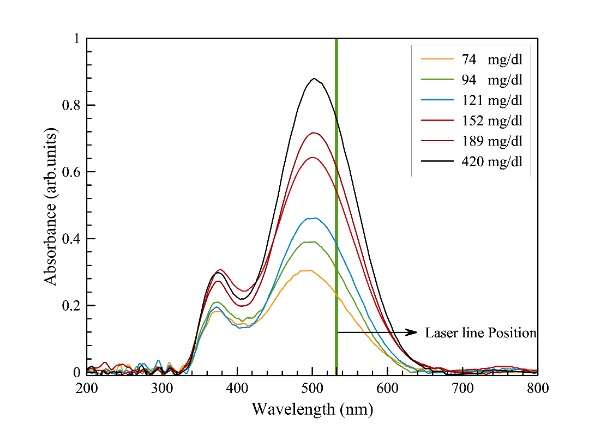 Fig. 2.
 UV-Vis spectrum of blood serum containing different concentration of glucose with 1000 µl reagent
Fig. 3. The closed-aperture Z-scan transmittance experimental data (blue circle) and
fitted curves (red trace) using Eq. 1 for various concentrations of glucose in serum
Fig. 4. The closed-aperture Z-scan transmittance experimental data (blue circle) and
fitted curves (red trace) using Eq.1 for various concentrations of triglyceride in serum
Fig. 5. The closed-aperture Z-scan transmittance experimental data (blue circle) and
fitted curves (red trace) using Eq. 1 for various concentrations of cholesterol in serum
Table 1. Nonlinear refractive index values for blood serum with glucose, triglycerides, and cholesterol
Biochemical analytes
concentration (mg/dl) |
α (1/mm) |
Leff (mm) |
n2×10-8 cm2/w |
| Glucose |
| 74 |
0.76 |
0.98 |
-2.3 ± 0.28 |
| 94 |
0.88 |
0.91 |
-2.8 ± 0.14 |
| 121 |
1.12 |
0.89 |
-3.5 ± 0.12 |
| 152 |
1.63 |
0.86 |
-4.7 ± 0.14 |
| 240 |
1.76 |
0.84 |
-6.1 ± 0.21 |
| 70† |
--- |
--- |
-1.819 |
| 80† |
--- |
--- |
-2.092 |
| 90† |
--- |
--- |
-2.345 |
| 100† |
--- |
--- |
-2.673 |
| 110† |
--- |
--- |
-2.964 |
| 120† |
--- |
--- |
-3.206 |
| Triglycerides |
| 66 |
0.58 |
0.94 |
-3.5 ± 0.14 |
| 140 |
1.06 |
0.90 |
-4.5 ± 0.70 |
| 251 |
1.29 |
0.88 |
-6.3 ± 0.42 |
| 400 |
1.48 |
0.86 |
-7.5 ± 0.70 |
| 480 |
1.75 |
0.85 |
-8.4 ± 0.21 |
| 100* |
--- |
--- |
-0.75 ± 0.07 |
| 200* |
--- |
--- |
-1.48 ± 0.08 |
| 300* |
--- |
--- |
-2.18 ± 0.09 |
| 400* |
--- |
--- |
-2.87 ± 0.08 |
| 500* |
--- |
--- |
-3.84 ± 0.09 |
| Cholesterol |
| 133 |
2.10 |
0.82 |
-2.3 ± 0.10 |
| 153 |
2.69 |
0.77 |
-3.2 ± 0.11 |
| 200 |
2.96 |
0.75 |
-3.9 ± 0.10 |
| 247 |
3.42 |
0.72 |
-4.3 ± 0.11 |
| 266 |
3.91 |
0.71 |
-5.4 ± 0.24 |
| 200* |
--- |
--- |
-2.49 ± 0.08 |
| 220* |
--- |
--- |
-2.62 ± 0.09 |
| 240* |
--- |
--- |
-2.80 ± 0.07 |
| 260* |
--- |
--- |
-3.06 ± 0.06 |
| 280* |
--- |
--- |
-3.23 ± 0.07 |
| 300* |
--- |
--- |
-3.47 ± 0.09 |
Fig. 6. Variation of measured nonlinear refractive indexes with different concentrations of (a) glucose, (b) triglyceride, and (c) cholestrol in serum samples
Discussion
The relative position of the peak and the transmittance valley determines the sign of the nonlinear refractive index. In the case of a positive nonlinear refractive index, T(Z) presents the valley first, followed by the peak, whereas in the case of a negative nonlinear refractive index, T(Z) presents the peak first, followed by the valley. The recorded normalized transmittance curves reveal a peak followed by a valley (Fig. 3, Fig. 5), indicating that the serum samples exhibit a negative nonlinear refractive index.
The values of ∆Tp-v obtained in recorded normalized transmittance curves, and therefore derived nonlinear refractive indices of samples, are proportionally varying by increasing concentrations of biochemical analytes in serums, as shown in Figs. 3, 4, and 5. The normalized transmittance plot shows symmetric peaks and valleys. Because of the effects of weak nonlinear absorption of samples and the temperature impact, Eq. 1 can be employed in the fitting procedure of experimental data to determine the value of ∆Φ0. Using the estimated ∆Tp-v, ∆Φ0 values obtained by fitting normalized transmittance curves with Eq. 1 and Eq. 5, as well as other pertinent parameters indicated above, we can measure nonlinear refractive indices at the concentrations presented in Table 1. The estimated values of n2 for different samples at different concentrations are comparable to previously reported values of Refs. [11] and [15], which were obtained under different experimental parameters.
Figures 6 (a), (b), and (c) demonstrate a linear trend of the estimated refractive index values at different sample concentrations. The linear calibration curve depicted in Fig. 6 (a), (b), and (c) can be utilized to determine the approximate concentration of unknown biochemical analytes in blood serum. For instance, the test point in Figure 6(a) shows an estimated value of 190 mg/dl derived from a calibration formula and measuring n2 amount for glucose concentration in a blood serum sample, which is very close to the measured clinical value of 197 mg/dl.
Conclusion
Using the Z-Scan technique, the variation of the nonlinear optical responses of three blood serum containing biochemical analytes, including glucose, triglycerides, and cholesterol, is evaluated separately. The results indicate that each of the biochemical analytes in blood serum has a nonlinearity of self-defocusing, due to the negative nonlinear refraction indexes. The observed behavior of the transmittance curve as a function of analytes concentration indicates that as concentration increases, the difference between peak and valley increases proportionally. This behavior can be used as an experimental index to evaluate and measure the concentration of different biochemical analytes. Moreover, due to the nonlinear optical properties of biological samples, the Z-Scan method may be used in associated with other conventional methods to determine the concentration of biochemical analytes in blood, blood plasma, or blood serum. Furthermore, dilution in sample preparation appears unnecessary using the Z-Scan method compared to other conventional techniques, based on the nonlinear optical properties of samples with a high concentration of biochemical analytes.
Conflict of Interest
The authors declare that they have no conflict of interest.
Acknowledgments
The authors would like to thank Kasra Pathobiology Laboratory staff for their technical supports in providing samples.
References
- Albalasmeh AA, Berhe AA, Ghezzehei TA. A new method for rapid determination of carbohydrate and total carbon concentrations using UV spectrophotometry. Carbohydrate Polymers 2013; 97(2): 253-61.
- Gee CT, Kehoe E, Pomerantz WC, Penn RL. Quantifying protein concentrations using smartphone colorimetry: a new method for an established test. Journal of Chemical Education 2017; 94(7): 941-45.
- Penders J. Applications of flow cytometry, reflectance test strip reading and specific proteins in modern urinalysis, Ghent University. [Thesis], 2006.
- Ferreras FM, Wolfbeis OS, Gorris HH. Dual lifetime referenced fluorometry for the determination of doxorubicin in urine. Analytica Chimica Acta. 2012; 729(1): 62-6.
- Riche M. Analysis of refractometry for determining total plasma protein in hybrid striped bass (Morone chrysops× M. saxatilis) at various salinities. Aquaculture 2007; 264(1-4): 279-84.
- Obeid AE, Alwatari YA, Culligan KG, Henari FZ. Z-Scan method for measurement of bovine serum albumin concentrations. Journal of Biomedical Science and Engineering 2012; 5(5): 290-93.
- Varnavski O, Ispasoiu RG, Narewal M, Fugaro J, Jin Y, Pass H, et al. Nonlinear optical properties of water-soluble polymeric dyes with biological applications. Macromolecules 2000; 33(11): 4061-4068
- Sheik-Bahae M, Said AA, Van Stryland EW. High-sensitivity, single-beam n2 measurements. Optics Letters 1989; 14(17): 955-57.
- Sheik-Bahae M, Said AA, Wei TH, Hagan DJ, Van Stryland EW. Sensitive measurement of optical nonlinearities using a single beam. Journal of Quantum Electronics 1990; 26(4): 760-69.
- Gómez SL, Turchiello RF, Jurado MC, Boschcov P, Gidlund M, Neto AF. Characterization of native and oxidized human low-density lipoproteins by the Z-Scan technique. Chemistry and Physics of Lipids 2004; 132(2): 185-95
- Dhinaa AN, Nooraldeen AY, Murali K, Palanisamy PK. Z-Scan technique as a tool for the measurement of blood glucose. Laser Physics 2008; 18(10): 1212-216
- Martins Costa MF. 8th Iberoamerican Optics Meeting and 11th Latin American Meeting on Optics, Lasers, and Applications 2013; 11: 8785.
- Dhinaa AN, Palanisamy PK. Z-Scan technique: To measure the total protein and albumin in blood. Journal of Biomedical Science and Engineering 2010; 3(03): 285-90.
- Dhinaa AN, Palanisamy PK. Optical nonlinearity in measurement of urea and uric acid in blood. Natural Science 2010; 2(02): 106-111.
- Dhinaa AN, Palanisamy PK. Z-Scan technique for measurement of total cholesterol and triglycerides in blood. Journal of Innovative Optical Health Sciences 2009; 2(03): 295-301.
- Obeid AE, Alwatari YA, Culligan KG, Henari FZ. Z-Scan method for measurement of bovine serum albumin concentrations. Journal of Biomedical Science and Engineering 2012; 5(5): 290-93.
- Nabeshima CT, Alves SI, Neto AM, Silva FR, Samad RE, Courrol LC. Z-Scan technique: A new concept for diagnosis of prostate cancer in blood. Frontiers in Optics 2016; 17: JTh2A-132.
- Ghader A, Ara MH, Mohajer S, Divsalar A. Investigation of nonlinear optical behavior of creatinine for measuring its concentration in blood plasma. Optik 2018; 158(3): 231-36.
- Kafafi ZH, Lindle JR, Pong RG, Bartoli FJ, Lingg LJ, Milliken J. Off-resonant nonlinear optical properties of C60 studied by degenerate four-wave mixing. Chemical Physics Letters 1992; 188(5-6): 492-96.
- Couris S, Renard M, Faucher O, Lavorel B, Chaux R, Koudoumas E, et al. An experimental investigation of the nonlinear refractive index (n2) of carbon disulfide and toluene by spectral shearing interferometry and Z-Scan techniques. Chemical Physics Letters 2003; 369(3-4): 318-24.
- Liu ZB, Yan XQ, Tian JG, Zhou WY, Zang WP. Nonlinear ellipse rotation modified
Z-Scan measurements of third-order nonlinear susceptibility tensor. Optics Express 2007; 15(20): 13351-3359.
- Jasim KE. Third-order nonlinear optical properties of quantum dots. Standards, Methods and Solutions of Metrology; 2019.
- Barham D, Trinder P. An improved colour reagent for the determination of blood glucose by the oxidase system. Analyst 1972; 97(1151): 142-45.
- Rifai N, Bachorik PS, Albers JJ. Lipids, lipoproteins and apolipoproteins. Tietz Textbook of Clinical Chemistry 1999; 3: 809-861.
- Deeg R, Ziegenhorn J. Kinetic enzymic method for automated determination of total cholesterol in serum. Clinical Chemistry 1983; 29(10): 1798-802.


.jpg)


